Figures & data
Fig. 1. The multiplex bead-based platform. (a) Workflow of the multiplex platform. Isolated EVs or cell culture supernatant were incubated overnight with up to 39 different bead populations, each coupled to a different capture antibody. The different bead populations are distinguishable by flow cytometry. EVs bound to the beads were detected with single antibodies, e.g. cell-specific markers, or exosome markers such as anti-CD9-APC, anti-CD63-APC, anti-CD81-APC antibodies, or with a cocktail of the latter 3 antibodies. (b–d) Analysis example showing (b) exclusion of doublets and no bead events, (c) discrimination of differently labelled bead populations, and (d) measurement of signal intensities of the single bead populations. Positive bead populations are highlighted in colours. Black events represent beads that did not bind EVs or beads with EVs not detected by the staining cocktail.
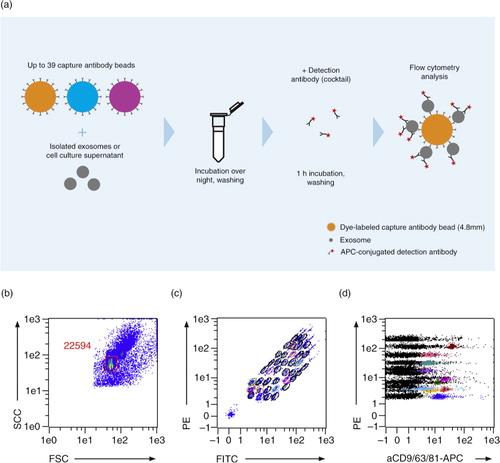
Fig. 2. Surface marker profiles of NK and platelet EVs. Background corrected APC median signal intensities after incubation of NK cell–derived EVs from 4 donors (8 µg each) or platelet-derived EVs from 11 donors (32 µg each) with 39 capture antibody bead populations, followed by staining with a cocktail of anti-CD9-, anti-CD63- and anti-CD81-APC antibodies. REA, mIgG1, mIgG2a and mIgG2b indicate isotype control-beads, i.e. beads linked to an antibody which does not bind EVs.
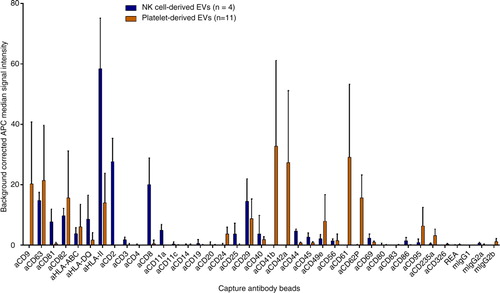
Fig. 3. (a, b) Theoretical example of matrix profiles (a) of EVs carrying 10 molecules A and 1 molecule B on each EV or (b) of EVs carrying 10 molecules A and 50% of the EVs comprise also 10 molecules B. Every detected molecule giving a signal of 1 light unit. (c–f) Background corrected APC median signal intensities of anti-CD9-, anti-CD63-, anti-CD81-beads and isotype control-beads after incubation with (c) 16 µg NK cell–derived EVs, (d) 16 µg platelet-derived EVs, (e) a mixture of NK cell–derived EVs and platelet-derived EVs (8 µg each) or (f) 8 µg monocyte-derived EVs, followed by staining with anti-CD9-APC, anti-CD63-APC, or anti-CD81-APC antibodies or with a cocktail of these antibodies. MIgG1 indicates isotype control-beads.
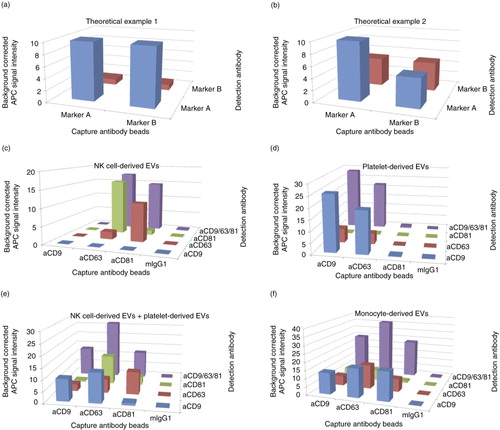
Fig. 4. Matrix profile of B cell EVs. Background corrected APC median signal intensity of different capture antibody bead populations after incubation with 32 µg EVs from activated B cells, followed by staining with anti-CD19-APC, anti-CD20-APC, anti-CD69-APC, anti-CD80-APC, anti-CD86-APC, anti-HLA-DQ-APC, or a cocktail of anti-CD9-APC, anti-CD63-APC and anti-CD81-APC antibodies. REA and mIgG1 indicate isotype control-beads.
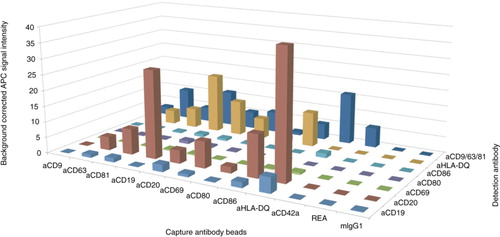
Fig. 5. NK cell–derived EVs bound to an anti-CD63-coated glass slide, stained with anti-CD81-STAR RED, and visualized by (a) confocal microscopy at 100-fold magnitude and (b) STED. (c) Intensity profile of the image section marked with the white line after confocal microscopy (grey) and STED microscopy (red). Scale bars represent 1 µm.
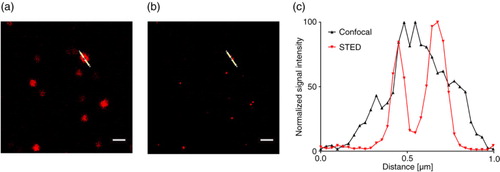
Fig. 6. STED analysis of EVs bound to an anti-CD63-coated glass slides. (a) A mixture of NK cell EVs and platelet EVs stained with anti-CD9-STAR488 and anti-CD81-STAR RED and (b) the corresponding intensity profile. Scale bar represents 500 nm.
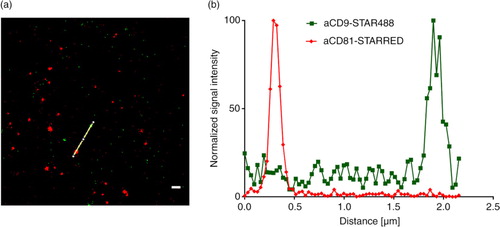
Fig. 7. STED analysis of B cell EVs bound to anti-CD9/63/81-coated slides and stained with (a) anti-CD19-STAR488 and anti-CD9-STAR RED or (b) stained with anti-CD9-STAR488 and anti-CD42a-STAR RED. Scale bars represent 500 nm.
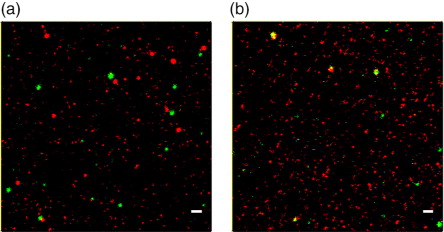
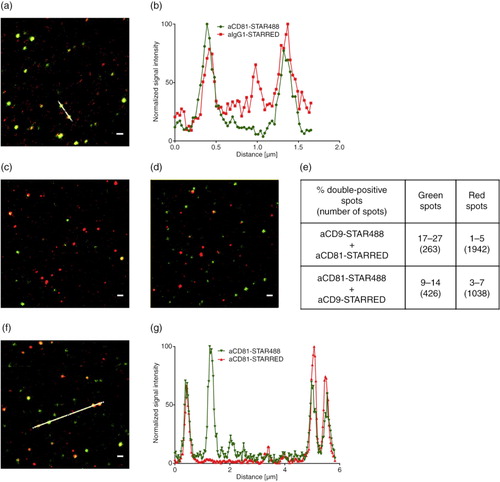
Fig. 8. STED analysis of EVs bound to anti-CD63-coated glass slides. (a) Monocyte EVs stained with anti-CD81-STAR488 and anti-IgG1-STAR RED and (b) corresponding intensity profile, (c) monocyte EVs stained with anti-CD9-STAR488 and anti-CD81-STAR RED and (d) monocyte EVs stained with anti-CD81-STAR488 and anti-CD9-STAR RED. (e) Overview of the percentage of double-positive monocyte EVs from 3 images and total number of analysed spots. (f) Monocyte EVs stained with anti-CD81-STAR488 and anti-CD81-STAR RED and (g) corresponding intensity profile. Scale bars represent 500 nm.