
Figures & data
Fig. 1. Workflow of urine collection. (a) Collection of void urine including individual approach for bacterial assessment and pooled for comprehensive analysis of extracellular vesicle RNA. (b) Consecutive collection from individual donors for bacterial presence assessment. 1) Protocol to obtain HFDa; 2) protocol to obtain HFDa0.22 µm; 3) protocol to obtain HFDatablet; 4) protocol of microbiological analysis with HFDa fractions; and 5) differential centrifugations protocol for microbiological analysis.
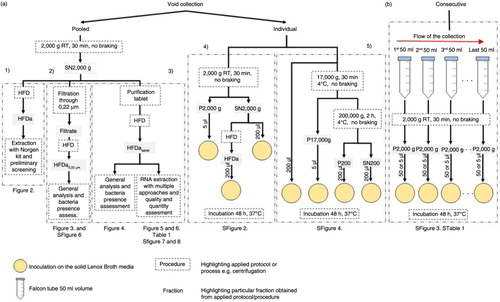
Fig. 2. Profiles of isolated RNA analyzed by Agilent 2100 Bioanalyzer in PicoChip (electropherograms). (a) UEVs RNA enriched via HFD and isolated with Norgen Kit; (b) cellular RNA extracted with FastRNA Kit; (c) UEVs with spike-in of cellular RNA; (d) cellular RNA re-extracted with Norgen Kit; (e) UEVs RNA, cellular RNA and UEVs+cellular RNA electropherograms merged together according to nucleotide size axis; (f) bacterial RNA; (g) cellular RNA and bacterial RNA mixed and run together; (h) cellular RNA and bacterial RNA electropherograms merged together according to nucleotide size axis. Grey arrow – marker dye; blue arrow – UEVs rRNA; red arrow – 18s and 28s rRNA; black arrow – 16s and 23s rRNA.
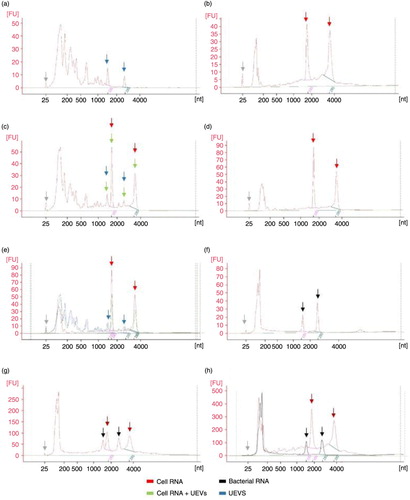
Fig. 3. Performance of 0.22 µm filtration and its impact on HFDa fraction (referred as HFDa0.22 µm). (a) Microbiological testing of fractions HFDa0.22 µm experiment performed in triplicate; (b) SDS-PAGE stained with colloidal Coomassie; (c) western blots with anti-ALIX, anti-TSGl0l; and (d) anti-DPPlV, anti-CD63; (e) PicoChip, (f) Small Chip electropherograms from HFDa0.22 µm RNA extracted with Norgen Kit; ST-molecular weight marker, 1,2,3 – HFDa0.22 µm fractions (triplicate), 4,5,6 – SDS elution from Steritop filters (triplicate), kDa – kilodalton.
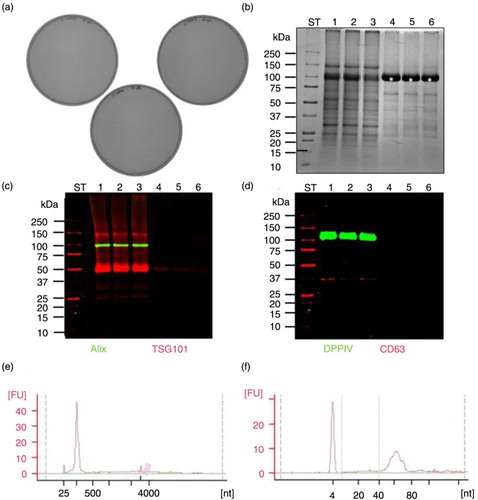
Fig. 4. Performance of HFD with purification tablet treated SN2,000g (HFDatablet). (a) Microbiological testing of HFDatablet fraction; (b) SDS-PAGE stained with colloidal Coomassie; (c) western blots with anti-ALIX, anti-TSG101; and (d) anti-DPPIV, anti-CD63; (e) transmission electron microscopy picture of vesicles in HFDatablet fraction; lectin blots with (f) MAL II and (g) SNA; (h) Small RNA Chip profiles of HFDatablet and (i) HFDa0.22 µm. ST-molecular weight marker, 1 – HFDatablet, 2 – HFDa0.22 µm, kDa – kilodalton; white asterisk – uromodulin (Tamm-Horsfall protein); red rectangle – MAL II recognized glycoproteins; green rectangle – SNA recognized glycoproteins.
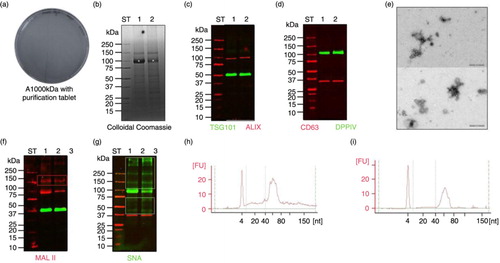
Table I. RNA yield results.
Fig. 5. Pico 6000 RNA Chip electropherograms run in Agilent 2100 Bioanalyzer for RNA samples coming from UEVs extracted with different methods: (a) FastRNA; (b) Qiagen; (c) TRIzol; (d) Norgen; (e) Nucleo-Spin; (f) Quick RNA; (g) mirVana; nt – nucleotide size, grey arrow – marker peak, FU – fluorescence units.
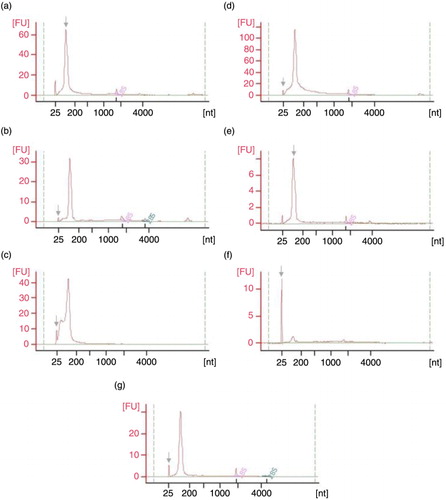
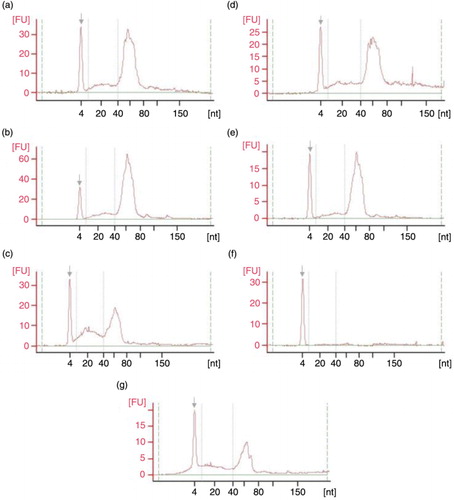
Fig. 6. Small RNA Chip electropherograms run in Agilent 2100 Bioanalyzer for RNA samples coming from UEVs extracted with different methods: (a) FastRNA; (b) Qiagen; (c) TRIzol; (d) Norgen; (e) Nucleo-Spin; (f) Quick RNA; (g) mirVana; nt – nucleotide size, grey arrow – marker peak, FU – fluorescence units.