Figures & data
Fig. 1. CPPs exhibited distinct membrane changes by field emission scanning electron microscopy (FESEM) analysis, disturbance of intracellular organization and lack of activation response observed by transmission electron microscopy (TEM). (a) FESEM analysis of liquid-stored platelets (LSPs) and cryopreserved platelets (CPPs). (b) TEM of resting and thrombin receptor activating peptide (TRAP-6, 20 µM) activated liquid-stored PLTs (LSPs) and cryopreserved PLTs (CPPs).
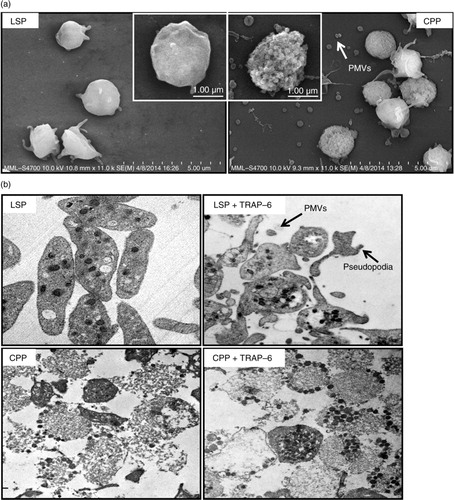
Fig. 2. Transmission electron microscopy (TEM) and atomic force microscopy (AFM) analysis of platelet membrane vesicles (PMVs) in cryopreserved PLTs (CPPs). (a) Transmission electron microscopy (TEM) of PMVs in pellet of 20,000 g spun CPP2K (CPP20Kp) and 100,000 g spun CPP20K (CPP100Kp). (b) AFM analysis of PMVs in supernatant of 2,600 g spun CPP (CPP2K) and pellet of 100,000 g spun CPP20K (CPP100Kp).
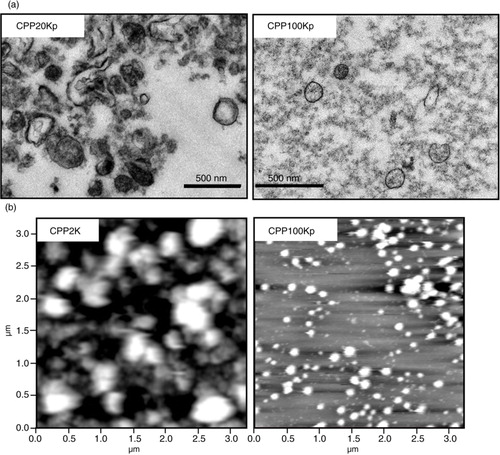
Fig. 3. 6% dimethyl sulfoxide (DMSO) treatment alone and with freezing–thawing increased platelet membrane fluidity. The decrease of DPH fluorescence polarization (−δ DPH polarization (%)) of liquid-stored platelets (LSPs), LSP with 6% DMSO content without freezing (6% DMSO LSPs) and cryopreserved platelets (CPPs) were assayed. 30 nmol/L membrane fluidizer halothane was used as a positive control. Individual data points normalized with corresponding LSPs are presented in scatter plot (mean); n = 7 donors; *p ≤ 0.05.
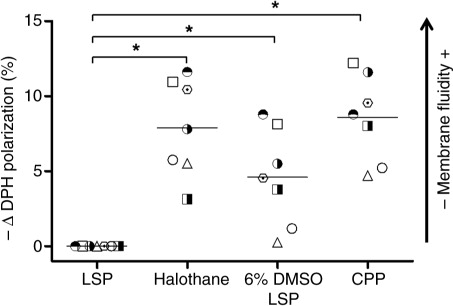
Fig. 4. Flow cytometric analysis showed increase of platelet surface exposure of phosphatidylserine and CD62P on cryopreserved PLTs (CPPs) compared to liquid-stored PLTs (LSPs). (a) LSPs and CPPs representative dot plots showing forward scatter (FSC)/side scatter (SSC), double fluorescence dot plots showing CD41a+ (FITC)/CD62P+ (PE) and CD41a+ (FITC)/annexin V (PE). (b) CD62P+ and annexin V-binding populations in liquid-stored platelets (LSPs) and cryopreserved platelets (CPPs) are calculated as percentage of CD41a+ platelets. Individual data points are shown in scatter plots (mean); n = 3 donors; **p < 0.01.
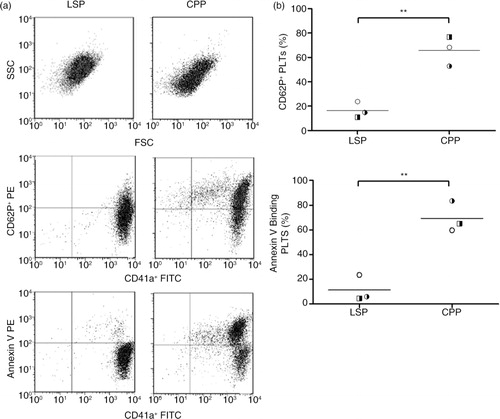
Fig. 5. Flow cytometric analysis revealed marked increase of PLT-derived extracellular microvesicles (PMVs) in cryopreserved PLTs (CPPs) compared to liquid-stored platelets (LSPs). (a) Representative annexin V (FITC)/CD41a+ (PE) double fluorescence plots of PMVs in supernatants of 2,600 g spun LSPs and CPPs (LSP2K, CPP2K). (b) Counts of released annexin V binding, CD41a+ and annexin V binding/CD41a+ PMVs are shown in scatter plots (mean) for individual donors; n = 4; ***p < 0.001. (c) Forward scatter (FSC-PMT) histogram comparing size of LSP2K and CPP2K PMVs with that of the polystyrene bead size standards (hydrodynamic diameter, nm).
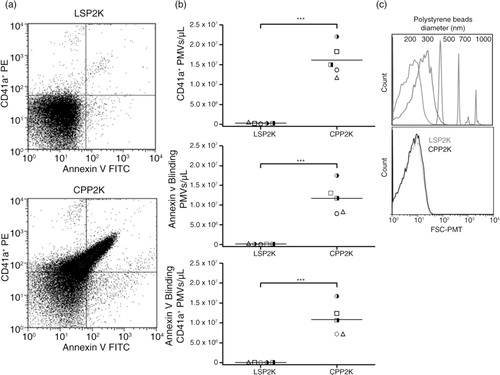
Fig. 6. Nanoparticle tracking analysis shows 5 times higher counts of exosome-size PLT-derived extracellular microvesicles (PMVs) in cryopreserved platelets (CPPs) compared with liquid-stored platelet-processing controls (LSP-PCs). (a) Representative nanoparticle tracking analysis (NTA) video frames of PLT-derived extracellular microvesicles (PMVs) in 2,600 g spun LSP-PCs and CPPs supernatants (CPP2K, LSP-PC2K). (b) Histogram showing size distribution of PMVs and bar graph showing total count of PMVs released in LSP-PC2K and CPP2K per 1 mL. Data shown in mean±SD from n = 3 donors.
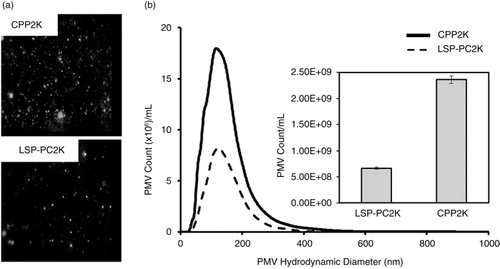
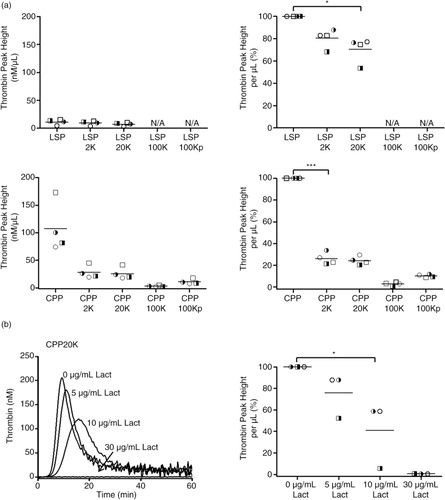
Fig. 7. Thrombin-generating procoagulant activity (TG-PCA) of cryopreserved platelets (CPPs) was 2-folds higher per PLT and 9-folds higher per µL as compared to liquid-stored platelets (LSPs). (a) Thrombin generation curve of LSPs and CPPs serially diluted in 2 folds. The first sample of LSPs, shown in solid line, was taken directly from the apheresis bag while CPPs, also shown in solid, were pre-diluted. (b) Thrombin peak height (TPH)/106 PLTs of LSP and CPP units. (c) TPH/1 µL of LSP and CPP units. Individual data points collected from n=12 donors are presented in scatter plots (mean); **p<0.01 and ***p<0.001.
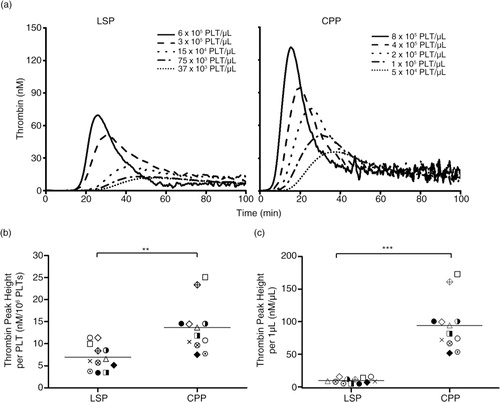
Fig. 8. Distribution of thrombin-generating procoagulant activity (TG-PCA) of liquid stored platelet (LSP) and cryopreserved platelet (CPP) products and their derived supernatants; Inhibition of TG-PCA by lactadherin. (a) TG-PCA of liquid stored platelets (LSPs) and cryopreserved platelets (CPPs) and their differentially centrifuged supernatants are presented as thrombin peak height (TPH)/µL and in % activity of corresponding LSP and CPP products. Scatter plots (mean) represent individual data points collected from n = 4 donors; *p ≤ 0.05 and ***p ≤ 0.001. N/A not assayed. b) Representative thrombin generation curves show the inhibition of TG-PCA of CPP20K supernatant with 5 µg/mL, 10 µg/mL and 30 µg/mL of lactadherin. Scatter plot (mean) shows individual data points as TPH/µL in % activity of CPP20K without lactadherin; n = 3 donors; *p ≤ 0.05.