Figures & data
Fig. 1. (a) Flow charts for the EV isolation procedure based on density gradient centrifugation. The original procedure is shown on the left, in which 15 ml of saliva was fractionated by 17 h of centrifugation through a gradient of iodixanol. The modified protocol (right) uses a fixed angle rotor for centrifugation to reduce the centrifugation time to 4 h. (b) Schema of the method of inserting EV fractions into step density gradient media. After centrifugation, fractions 1 to 6 were collected from the top of the gradient. For fractions 2 to 5, the regions flanking the interphase separating 2 neighbouring density gradient media layers were pooled together. (c) Chemical formula and molecular weight of sucrose, iohexol and iodixanol.
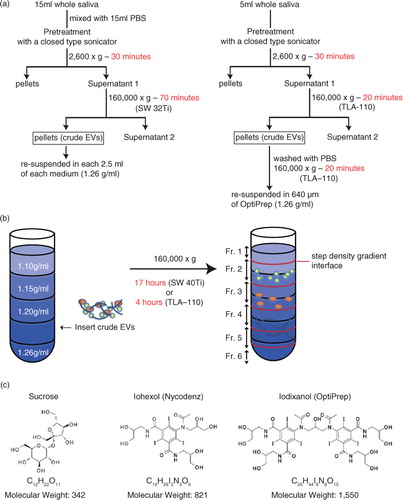
Fig. 2. The effects of gradient media on the fractionation of salivary EVs by density gradient centrifugation [left panel: sucrose; middle panel: iohexol; right panel: iodixanol]. (a) Molecules (mostly proteins) contained in each fraction were visualized by silver staining after electrophoresis in polyacrylamide gel (PAGE). The left panel shows molecular weight (MW) markers with their MW×10−3. Densities (g/ml) of the fractions are shown on the top. (b) Some of the EV markers were visualized by a WB method. The blotted membranes were incubated with antibodies against CD63, CD133, AQP5, β-actin, CD26, CD81, EpCAM, HSP70, TSG101, CD44, CD24 and CD9. Densities (g/ml) of the fractions are shown on the top. Numbers on the right indicate MW×10−3 of the marker.
![Fig. 2. The effects of gradient media on the fractionation of salivary EVs by density gradient centrifugation [left panel: sucrose; middle panel: iohexol; right panel: iodixanol]. (a) Molecules (mostly proteins) contained in each fraction were visualized by silver staining after electrophoresis in polyacrylamide gel (PAGE). The left panel shows molecular weight (MW) markers with their MW×10−3. Densities (g/ml) of the fractions are shown on the top. (b) Some of the EV markers were visualized by a WB method. The blotted membranes were incubated with antibodies against CD63, CD133, AQP5, β-actin, CD26, CD81, EpCAM, HSP70, TSG101, CD44, CD24 and CD9. Densities (g/ml) of the fractions are shown on the top. Numbers on the right indicate MW×10−3 of the marker.](/cms/asset/233fa827-d84d-424d-9faf-dc8dad60b495/zjev_a_11821271_f0002_ob.jpg)
Fig. 3. (a) The size distribution of each fraction analysed by nanoparticle tracking analysis (NTA). The left shows the results from iohexol and the right shows the results from iodixanol. (b and c) The numbers of particles included in each fraction was calculated using NTA.
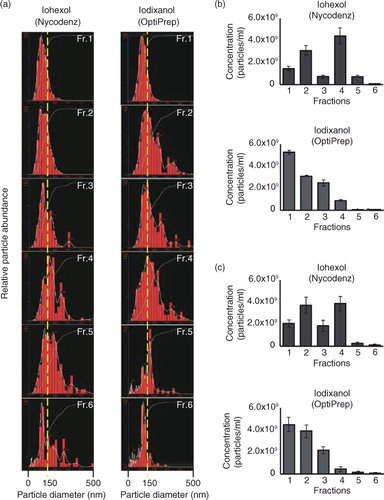
Fig. 4. (a) Atomic force microscopic (AFM) analyses of the fractions in PBS. The crude salivary EVs were fractionated through density gradients of sucrose (left), iohexol (middle) or iodixanol (right), and particles contained in each fraction were adsorbed on the mica precoated with 3-aminopropyltriethoxysilane and were scanned by MFP-3D-SA-J (Asylum Research) using the in liquid tapping mode. The colorimetric scale in the bottom indicates the Z dimension. (b) The height maps of the plausible EV-containing fractions. Fraction 4 of sucrose, fraction 3 of iohexol and fraction 2 of iodixanol were mapped with their heights along with the red line in the images. Labels of Δ1 to Δ 3 indicate the positions that had high height in the images.
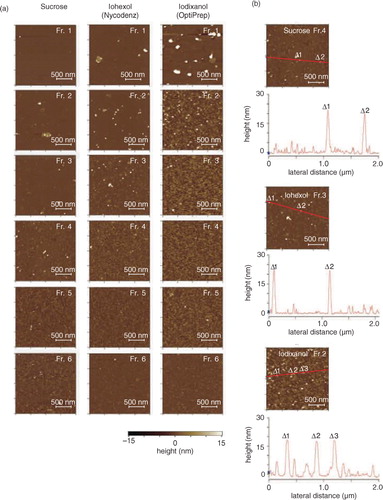
Fig. 5. Size distributions of EVs observed in AFM images obtained from fraction 2 in iohexol of saliva (left) and the conditioned medium of HT-29 (right). The diameters of AFM images were calculated by the image analysis software SPIP 6.3.6. In total, 36 and 53 particles were analysed for saliva and HT-29, respectively. Images were processed by SPIP 6.3.6 image analysis software.
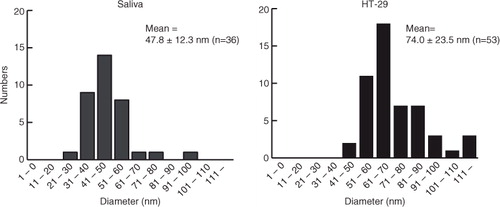
Fig. 6. Density gradient centrifugation using a fixed angle rotor, TLA-110. (a) The density gradient formed after 160,000×g centrifugation of pretreated salivary EVs in iodixanol for 4 h. The density of each fraction was determined by an automatic refractometer (RX-5000α). (b) Analysis of each fraction by silver staining. (c) Analysis of each fraction by WB. Numbers indicate MW×10−3 of markers.
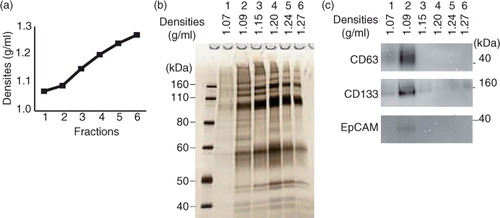
Fig. 7. Continued
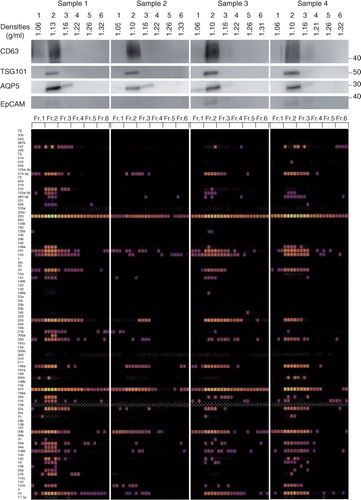
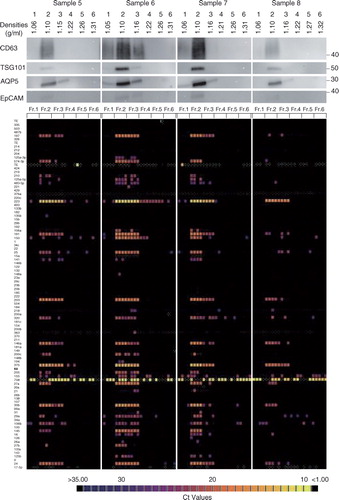
Fig. 7. Characterization of the salivary EVs from 8 healthy volunteers. WB analyses with anti-CD63, TSG101, AQP5 and EpCAM antibodies are shown on the top with MW×10−3 of markers. Quantities of 93 miRNAs were quantified by the TaqMan real-time PCR method using the BioMark HD system (Fluidigm), and calculated Ct values are shown in colour code (bottom). Numbers in the left indicate miRNAs tested that are listed in Supplementary Table I. The box with small white dots means the obtained amplification curve could not be analysed by the software of the BioMark HD system (no information). A technical replicate of n=4 was used to induce robust results.