Figures & data
Fig. 1. Flowchart for the isolation of plasma- and urine-derived vesicles. Blood was collected into EDTA vacutainers and pre-cleared of cells, filtered and frozen at −80°C in 1.5-ml aliquots. The plasma was subsequently thawed and vortexed prior to applying to the home-made 12-cm bed volume 30-cm long Sepharose CL-2B size-exclusion column. PBS EDTA was used as the mobile phase buffer and up to 30×500 µl fractions were collected (a). Urine was collected into 250-ml Stericups and pre-cleared of cells, filtered and frozen at −80°C in aliquots up to 50 ml. Upon thawing, the urine was vortexed and centrifuged and filtered a second time to eliminate sediment, and ultracentrifuged for 2 h, 4°C, 200,000×g. The subsequent pellet was resupended in 500 µl PBS and applied to a small 3-cm volume column made in a 2.5-ml syringe. An 18-gauge needle was attached to the bottom of the syringe to guide the sample accurately into 500-µl microcentrifuge tubes in up to 30×165 µl fractions (b). For both plasma and urine, each fraction was subject to analysis by ELISA-like assays, protein measurement, NTA, and when possible also by western blot. Alternatively, selected vesicle-rich fractions were pooled and concentrated/washed (200,000×g, 2 h, 4°C). The pellet was resuspended in a small volume of PBS, and protein and particle concentrations determined and stored at −80°C. Prior to SOMAscan® analysis, occasional samples were assessed by cryo-electron microscopy.
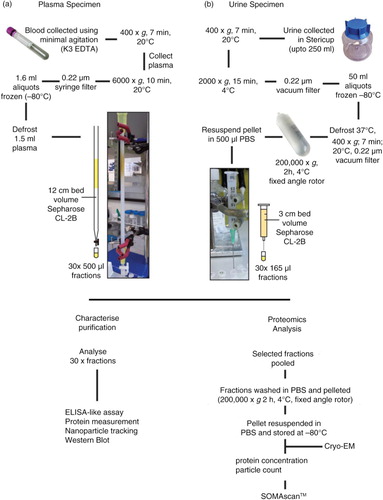
Fig. 2. Analysis of plasma fractionated by size-exclusion chromatography. Pre-cleared plasma was subject to separation on a 12-cm long Sepharose CL2B size-exclusion column, and 30× serial 500-µl fractions were collected and analysed. The protein concentration was estimated by NanoDrop™ (absorbance at 280 nm), and the particle concentration was measured by nanoparticle tracking analysis (NanoSight™). Individual fractions where NanoSight™ analysis was not performed are indicated (with an X). The ratio of particles to protein (particles/µg) was calculated and plotted (left axis: blue bars) with total protein on the right axis (red line) (a). A proportion of the same fraction series was immobilized onto high-protein-binding microplate strips and allowed to couple overnight. After blocking, wells were stained with primary antibodies against CD9, CD81, ApoB or HSA, and binding detected using a time-resolved fluorometric readout (arbitrary TRF units shown) (b). Selected fractions (F10 to F15), identified as vesicle rich but protein low by the aforementioned assays, were pooled and concentrated by ultracentrifugation. After re-suspending the pellet, a proportion was examined by cryo-EM (scale bar=100 nm), and representative fields are shown (c). A proportion was also analysed by nanoparticle tracking to examine the size distribution of particles in the final sample, and the histogram mean and mode is shown (based on triplicate measurements) (d).
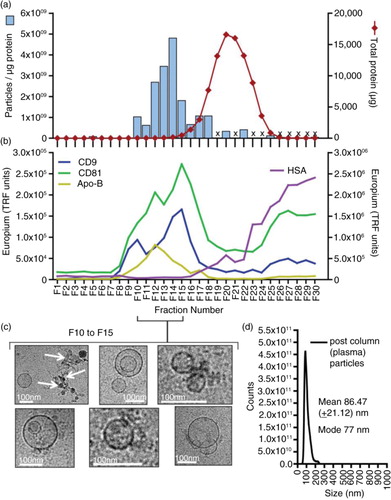
Fig. 3. Analysis of urine fractionated by ultracentrifugation and size-exclusion chromatography. Urine was concentrated by pelleting (200,000×g, 2 h, 4°C) and after re-suspending, the material was fractionated using a Sepharose CL-2B size-exclusion chromatography column. Thirty fractions were collected. Equal volumes of fraction 4 to fraction 25 were examined by western blotting; staining for the endo/lysosomal-related proteins including TSG101, ALIX, LAMP2 or for serum albumin (HSA). For this number of samples, 2 gels were required, and the position of the divide between the gels is indicated by a dotted line (a). In addition, the protein and particle concentrations were determined (for the latter, those that were not measured are denoted by an X). The particle-to-protein ratio was calculated and is plotted (blue bars) together with total protein estimation (red line) (b). A proportion of the same fraction series was immobilized onto high-protein-binding microplate strips and allowed to couple overnight. After blocking, wells were stained with primary antibodies against CD9, THP (uromodulin), HSA or isotype control, and binding detected using a time-resolved fluorometric readout (arbitrary TRF units shown) (c). Selected fractions (F5 to F12), identified as vesicle rich but protein low by the aforementioned assays, were pooled and concentrated by ultracentrifugation. After re-suspending the pellet, a proportion was examined by cryo-EM (scale bar=100 nm), and representative fields are shown (d). A proportion was also analysed by nanoparticle tracking to examine the size distribution of particles in the final sample, and the histogram mean and mode is shown (based on triplicate measurements) (e).
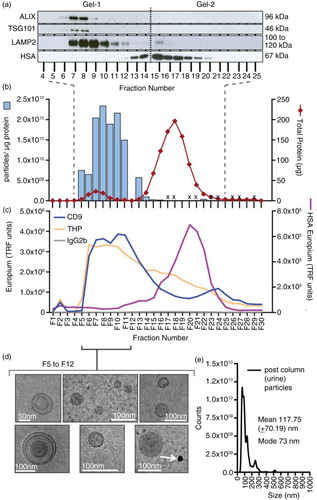
Fig. 4. Vesicle yields and purity. Urine or plasma specimens were collected from healthy male donors and processed by the aforementioned methods to generate a preparation of vesicles. For each run of plasma (n=10 donors), a total volume of 1.5 ml was processed. The urine donated (n=13), however, was more variable, ranging from 60 to 250 ml. The final vesicle preparations were measured for protein and particles and the data plotted as dot-plots where each symbol is a different donor, and the mean and standard error is shown. In (a), the data are corrected for the initial starting volume (p≤0.001), indicating that plasma provides greater quantity of particles and protein compared to urine. In (b), data show the total material achieved in the vesicle isolates irrespective of input volume. The particle-to-protein ratio as an estimation of sample purity is depicted in (c) (p≤0.001).
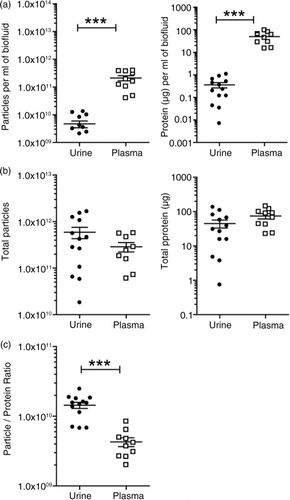
Fig. 5. Proteomics analysis of vesicles derived from healthy donor urine and plasma. A pool of healthy donor urine or plasma was used as a source of biofluid and for each, 3 separate isolation procedures were undertaken to generate technical replicates. To help evaluate the reproducibility of the preparation methods, the specimens were subject to protein profiling using the SOMAscan ® protein array. A total of 1,035 proteins was identified following background correction, and these are represented by a scatter plot of the loge of the RFU values for both exosome sources. The different coloured circles represent the statistical significance of each protein as determined by row-by-row t test (with BH correction), as indicated in parentheses (a). Some examples of proteins more highly expressed in urine (b) or plasma (c) are shown. A total of 392 proteins exhibited comparable expression levels (p≥0.05) in both urine- and plasma-derived vesicles (d). (Bars show mean RFU values±SD SD of triplicates, **p≤0.01, ***p≤0.001, ****p≤0.0001). The full data set is available as Supplementary Table 2. Venn diagram compares the urine results, with previously published studies of healthy donor urinary exosomes, using mass spectrometry, showing the degree of identifications in agreement across these data sets (e).
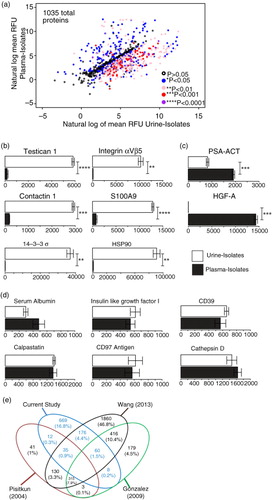
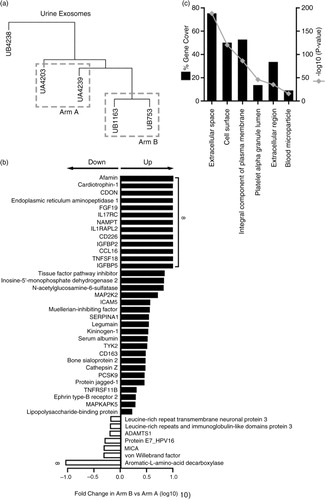
Fig. 6. Comparison of prostate cancer patient plasma-derived vesicles. Vesicle isolates were prepared from the plasma of metastatic prostate cancer patients and assayed by SOMAscan ® . Cluster analysis was performed (n=11 patients), and 3 samples were selected for further analysis from arms A and B; denoted by dashed line boxes. The sample identifiers are annotated with a letter “P” for plasma and then either an “A” or “B” denoting study arm (a). Of 990 proteins identified by the assay, 102 showed significance (p<0.05) between the 2 arms. Of these, 57 exhibited ≥±1.5-fold change difference in Arm B compared to Arm A (37 elevated and 20 reduced) (b). Results of functional enrichment analysis to examine the subcellular location of the proteins are depicted where the grey line represents log10 (p value) and black bars represent % gene coverage (c). The data set is shown in Supplementary Table 3A.
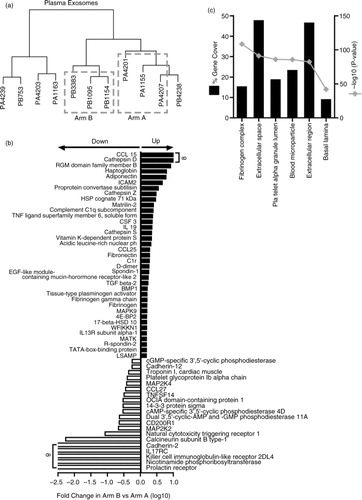
Fig. 7. Comparison of prostate cancer patient urine-derived vesicles. Vesicle isolates were prepared from the urine of metastatic prostate cancer patients and assayed by SOMAscan ® . Cluster analysis was performed (n=5 patients), and 2 samples were selected for further analysis from arms A and B, denoted by dashed line boxes. The sample identifiers are annotated with a letter “U” for urine and then either an “A” or “B” denoting study arm (a). In this case, 993 proteins were identified in this 2 versus 2 comparison, of which 62 proteins showed significance (p<0.05) between the 2 arms. Out of these, 41 proteins demonstrated 1≥±1.5-fold change difference in Arm B compared to Arm A (33 elevated, 7 decreased) (b). Results of functional enrichment analysis to examine the subcellular location of the proteins are depicted (c), where the grey line represents log10 (p value), and black bars represent % gene coverage. The data set is shown in Supplementary Table 3B.