Figures & data
Fig. 1. Typical size exclusion column (qEV) elution profiles of serum extracellular vesicles (EVs) depending on loading.
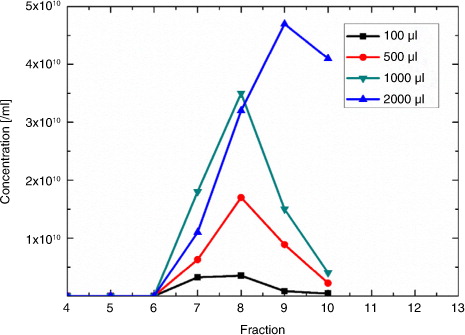
Fig. 2. Transmission electron microscopy (TEM) images of plasma EVs (a) before and (b) after qEV purification and (c) CD9+ immunogold-labelled EVs after qEV purification.
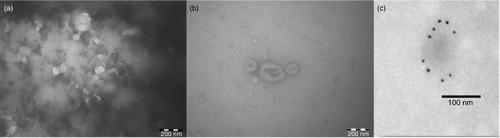
Fig. 3. Blockade rates and mean full width half maximum durations (insets) of CPC200 calibration particles (a) with and (b) without coating of the pore. Calibration particles were recorded before the serum (in black) and after the serum (in red), in order to assess pore modification processes.
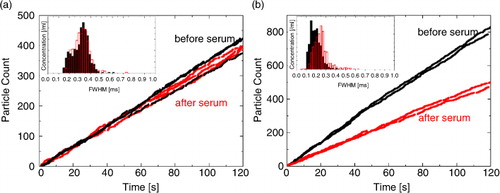
Fig. 4. (a) Typical size distribution of liposomes and (b) histogram of mean diameters of the complete liposome data set, including a total of 68 measurements.
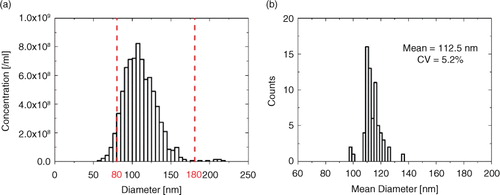
Fig. 5. (a) Concentration scatter and box plots and (b) concentration distribution for the complete liposome data set of 68 measurements. Protocol and “green zone” violations are marked with white circles within the scatter plot in (a).
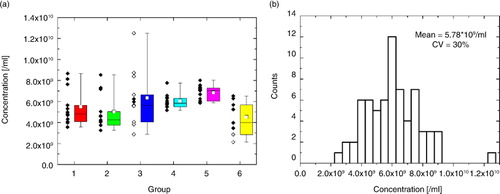
Fig. 6. Performance similarity across the 6 groups was qualitatively visualized in the principal component analysis (PCA) score plot (a). Samples cluster into 2 groups on principal component 1 (PC1), corresponding to data from the EV (+PC1) and calibration (−PC1) data. Data were colour coded according to the 6 groups. (b) PCA loadings plot was used to identify which parameters separated the sample and calibration data. FWHM=full width half maximum duration (as opposed to “duration,” which is the total blockade duration), RMS=root mean square, MRP=mid-range particle size, dI/I=relative blockade magnitude.
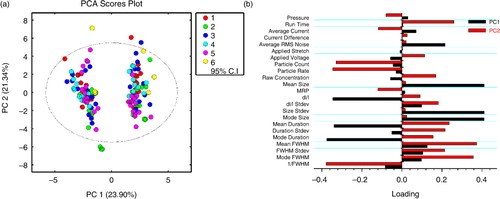
Fig. 7. (a) Concentration scatter and box plots and (b) concentration distribution for the complete EV data set of 74 measurements. Protocol and green zone violations are marked with white circles within the scatter plot in (a).
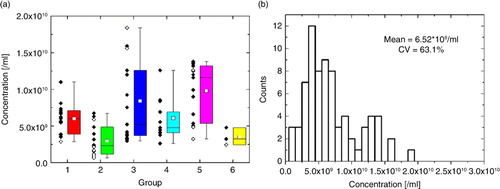
Table I. Mean concentrations (with 95% CI) and CVs for various analyses
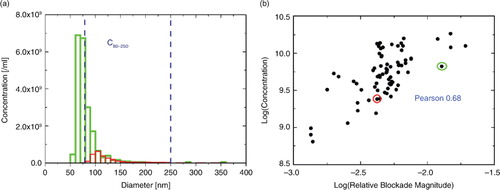
Fig. 8. (a) Typical EV size distributions with different lower detection limits. (b) Positive correlation between measured concentration and relative blockade magnitude of calibration is displayed; the circled measurements in red and green represent the size distributions.