Figures & data
Fig. 1 Work flow for isolation of extracellular vesicles from synovial fluid including enzymatic digestion of hyaluronic acid.

Table I. EV isolation and characterization methods for SF-derived EVs published between 1995 and 2016
Fig. 2. High-resolution FCM of EVs derived from SF; detection of PKH67+ EVs. EVs were isolated from HYase-treated or non-treated healthy SF, labelled with PKH67, floated in OptiPrep gradients, and analysed using high-resolution FCM in gradient fractions F1 (low density) to F9 (high density). (a) Quantification of PKH67+ events (single EVs) for the subsequent 10,000g, 100,000g, and 200,000g ultracentrifugation steps. Bars represent mean (n=2); error bars represent minimum and maximum observed values. (b) Representative scatter plots corresponding to Fig. 2a for gradient fractions F3–F6. In this figure, the arbitrary regions I–IV were set to indicate observed differences in the light-scattering properties of EVs in each fraction, indicative for the recovery of different EV populations.
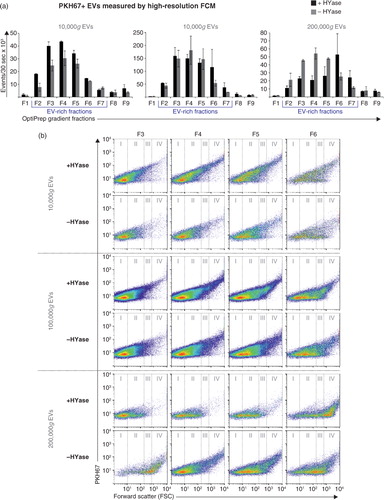
Fig. 3. Detection of CD9 (tetraspanin; EV marker) on EVs from healthy SF by Western blotting. EVs were isolated from HYase-treated or non-treated healthy SF and floated in OptiPrep gradients. (a) CD9 detection on EVs in pools of OptiPrep fractions F2–F7 (F2=low density; F7=high density). (b) Quantification of CD9+ bands from Fig. 3a. Bars represent mean (n=2); error bars represent minimum and maximum observed values.
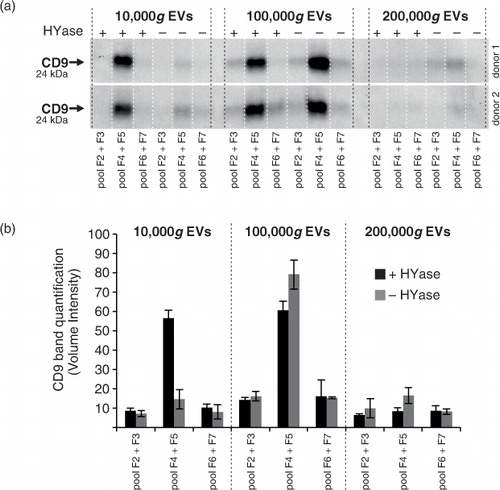
Fig. 4. Cryo-transmission-electron microscopy (cryo-TEM) analysis of EVs isolated from HYase-treated healthy SF. EVs were pelleted using centrifugation steps of 10,000g (=10,000g EVs), immediately followed by 200,000g, omitting the 100,000g step (=100/200,000g EVs, representing a pool of all EVs that are pelleted if using subsequent 100,000g and 200,000g centrifugation steps). Isolated EVs were floated in sucrose gradients followed by cryo-TEM analysis. (a) Representative images of EV distribution in the grid holes as they are most often observed. (b) Clusters of EVs occasionally observed for both centrifugation steps. (c) Quantification of typical EV morphologies found in healthy SF. Note that sometimes vesicle-like structures without clear membrane were also found, here referred to as “other small particles” (see also 4f). (d) Size distribution for 10,000g and 100/200,000g spherical EVs. (e) For both centrifugation conditions occasionally “granular” EVs were observed containing electron-dense granules. (f) Comparison of small EVs (with clear membrane; typically 20–40 nm) with “other small particles” (lacking a clear membrane; typically <20 nm) generally found in all images.
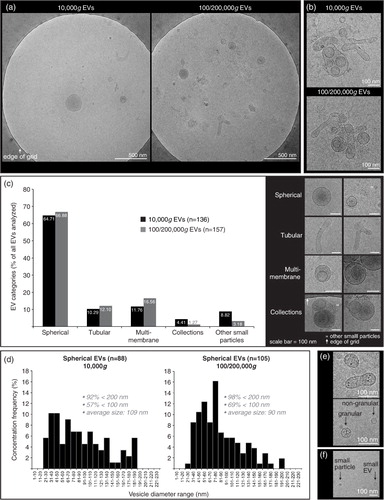
Fig. 5. High-resolution FCM of SF-derived EVs; detection of CD44+/PKH67+ EVs. EVs were isolated from HYase-treated or non-treated healthy SF, labelled with PKH67 and anti-CD44 antibody (PE-conj.) floated in OptiPrep gradients and analysed using high-resolution FCM. Scatter plots for the subsequent 10,000g, 100,000g, and 200,000g ultracentrifugation steps are shown for gradient fractions F3–F6 corresponding to Fig. 2b. Percentages of CD44+ events and absolute CD44+ numbers measured per 30 s were determined using a square gate based on the isotype control (pool of 100,000g and 200,000g EVS, labelled with PKH67 and CD44-PE isotype antibody).
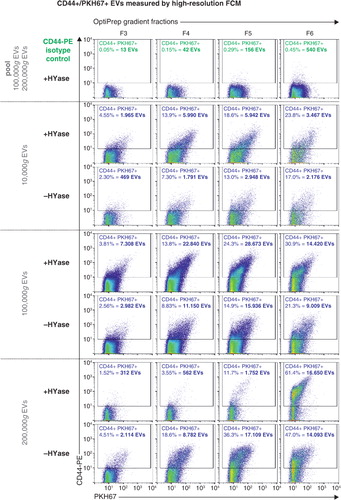
Fig. 6. (a) Comparison of PKH67+ EVs (black/grey bars) (data from Fig. 2) and CD44+/PKH67+ EVs (blue bars) (data from Fig. 5) measured by high-resolution FCM for the conditions +HYase and −HYase. (b) Ratio of CD44+ EVs relative to total EVs. The p-values indicate significantly higher total yield in the HYase-treated samples in the 10,000g and 100,000g centrifugation steps (paired analysis). Bars represent mean (n=2); error bars represent minimum and maximum observed values.
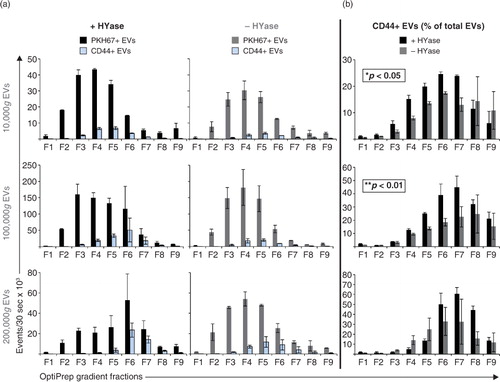
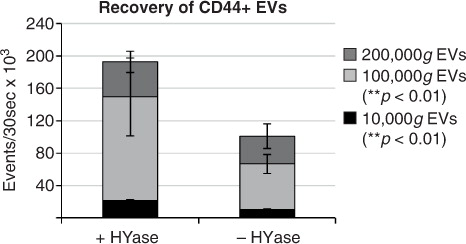
Fig. 7. Cumulative yield of CD44+ EVs in all ultracentrifugation steps (sum of event rates for 10,000g EVs+100,000g EVs+200,000g EVs present in gradient fractions F2–F7) in HYase-treated and non-treated samples. Bars represent mean (n=2); error bars represent minimum and maximum observed values. The p-values indicate significant higher recovery of CD44+ EVs in HYase-treated samples in the 10,000g and 100,000g centrifugation step.