Figures & data
Fig. 1. EVs loaded with dox decrease the viability of tumour cells in vitro. (a) Characterization of EVs produced by HEK-293 cells expressing or not Cx43 (EVCx43 + or EVCx43 − ) was performed by WB under non-reducing conditions. The presence of EV markers CD63 and CD81 was analysed. Calnexin was used as control for cell debris contamination. Equal amounts of protein (10 µg) from total cellular extracts from HEK-293Cx43 + were used as control. (b) Representative TEM image of EVCx43 + . Scale bars, 100 nm. (c) Ten micrograms of EVCx43 − or EVCx43 + was loaded with 100 µg dox by electroporation; not incorporated dox was washed out with PBS by ultracentrifugation. Values of EV-loaded dox (~10% EV pellet) were quantified by fluorescence detection (emission, 594 nm; excitation, 480 nm) and are depicted in the graph. Fluorescence reading of similar amounts of free dox was used as control (n = 10). (d) Representative TEM image of EVCx43 + dox after electroporation. Scale bars, 80 nm. (e) 4T1luc2 cells were treated with either 2 µM free dox or dox loaded into EVs containing or not Cx43 (EVCx43 + dox and EVCx43 − dox) for 24 h. Equal amounts of EVCx43 + or EVCx43 − were used for dox loading, and vehicle-treated cells were used as controls. Cell viability was assessed by flow cytometry analysis of propidium iodide (PI) exclusion and by counting the number of Trypan blue–excluding cells. Number of viable cells is represented as percentage of total cells (n = 3, p < 0.05 vs. CT, §p < 0.05, §§p < 0.01 vs. EVCx43 − , ##p < 0.01 ###p < 0.001 vs. EVCx43 + ). (f) Metabolic activity was assessed by MTT reduction (n = 3, *p < 0.05 vs. CT, §p < 0.05 vs. EVCx43 − , #p < 0.05 vs. EVCx43 + ).
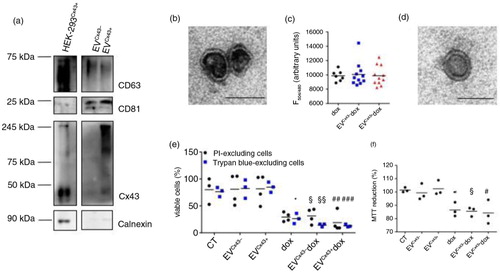
Fig. 2. EVs loaded with dox impair tumour cell proliferation in vitro. 4T1luc2 cells were treated with 2 µM free dox, EVCx43 + dox, EVCx43 − dox or vehicles, for 24 h. (a) Representative images of ki-67 immunostaining (green). Nuclei were stained with 4,6-diamidino-2-phenylindole (Dapi). Scale bars, 50 µm. Percentage of ki-67 (per total nuclei) is plotted in the graph (n = 3, *p < 0.05 vs. CT, §§§p < 0.001 vs. EVCx43 − , ###p < 0.001 vs. EVCx43 + ). (b) Cell proliferation was assessed by the BrdU assay. Treatment with epidermal growth factor (100 ng/ml, 24 h) was performed as positive control. Percentage of BrdU incorporation is plotted on the graph (n = 3, ##p < 0.01 vs. EVCx43 + ). (c) Cell cycle analysis was performed by flow cytometry, using PI (n = 3). (d) 4T1luc2 cells were treated with 2 µM free dox, EVCx43 + dox, EVCx43 − dox or vehicles, for 1 h. A Cx43-mimetic peptide (gap26, 0.25 mg/ml) was used, where indicated. Fresh media was added and the cells cultured for an additional 23 h. Cell proliferation was assessed by the BrdU incorporation assay (n = 3, *p < 0.05 vs. CT, #p < 0.05 vs. EVCx43 + , §p < 0.05 vs. EVCx43 + dox).
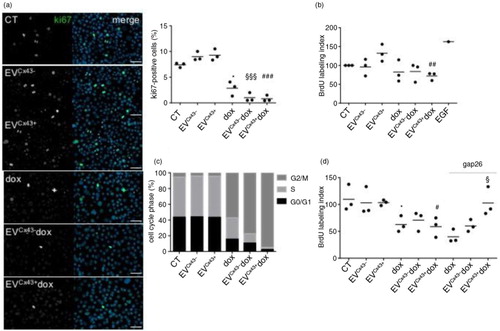
Fig. 3. Cx43-containing EVs loaded with dox decrease the activation of signalling pathways related to cell motility. The 4T1luc2 cells were treated with 2 µM free dox, EVCx43 + dox, EVCx43 − dox or vehicles, for 24 h. (a) Time-lapse microscopy was performed to assess cell motility, followed by individual cell tracking. Mean distance and velocity are plotted in the graph (n = 3, ###p < 0.001 vs. EVCx43 + ; *p < 0.05 EVCx43 + dox vs. dox;). Left panel shows representative images of the assay. Scale bar, 10 µm. (b) Activation of the p44/42 pathway was analysed by WB. Calnexin was used as loading control (n = 3, #p < 0.05 vs. EVCx43 + ).
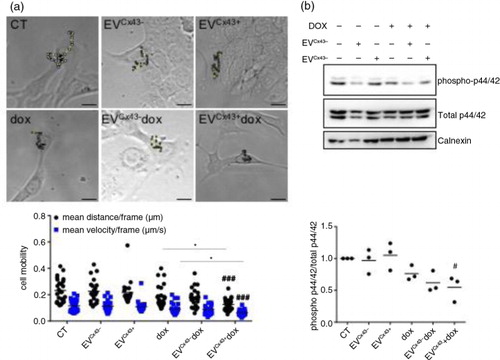
Fig. 4. EVs loaded with dox have anti-tumoural activity in 4T1luc2 tumour-bearing mice. Tumour-bearing mice were treated (i.t.) with 0.2 mg/kg of free dox, EVCx43 + dox or EVCx43 − dox or vehicles, on days 5 and 8 after subcutaneous inoculation of 4T1luc2 cells into opposed flanks. Equal amounts of EVs were used in each condition. (a) Representative BLI of mice 11 days after 4T1luc2 cells inoculation, corresponding to 3 days after the last treatment. (b) Tumour diameters were measured with a caliper, followed by determination of tumour volume (n = 5–8). (c) Representative images of excised tumours. (d) Average mass of excised tumours (n = 5–8). (e) WB analysis of Bax and Bcl2 in tumour lysates, for each treatment group. Ratio of Bax/Bcl2 is depicted on graph. Calnexin was used as loading control (n = 5, #p < 0.05 vs. EVCx43 + ).
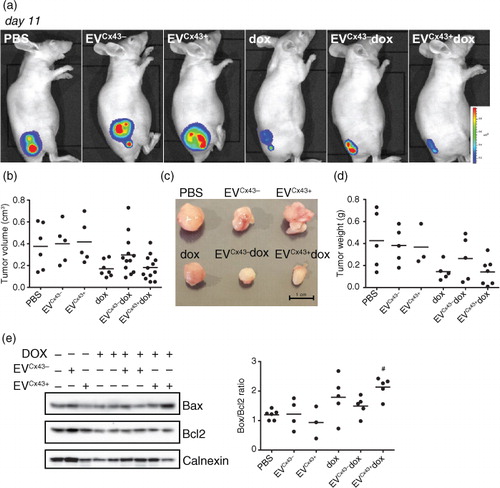
Fig. 5. EVs loaded with dox inhibit tumour growth in vivo. Representative serial BLI of mice bearing bilateral 4T1luc2 subcutaneous tumours before treatment (at day 5), and at days 8 and 11 after cells inoculation, corresponding to 3 days after the first and second treatments, respectively. Treatment groups received (i.t.) 0.2 mg/kg of free dox, EVCx43 − dox or EVCx43 + dox, on days 5 and 8. Equal amounts of EVs were used in each condition. (a) Tumour size was evaluated by quantification of bioluminescence signal (p/sec/cm2/sr) in a ROI drawn around the tumour. Graph depicts tumour progression of untreated and treated animals, normalized to the signal at the beginning of the treatment (n = 5, **p < 0.01 dox vs. vehicle, §§p < 0.01 EVCx43 + dox vs. vehicle, ##p < 0.05 EVCx43 + vs. vehicle). (b) Tumour diameters were measured to calculate tumour volume ratio between days 11 and 8 (n = 5–8, *p < 0.05 vs. vehicle, #p < 0.05 vs. vehicle).
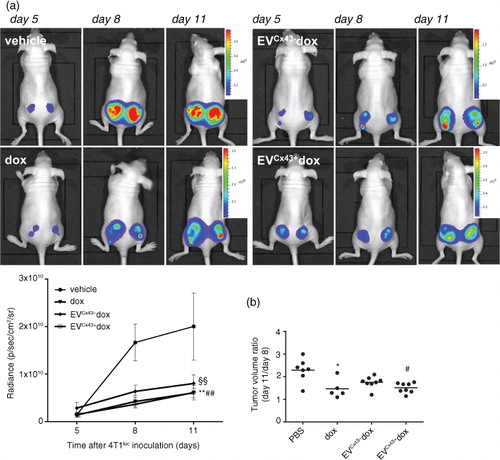
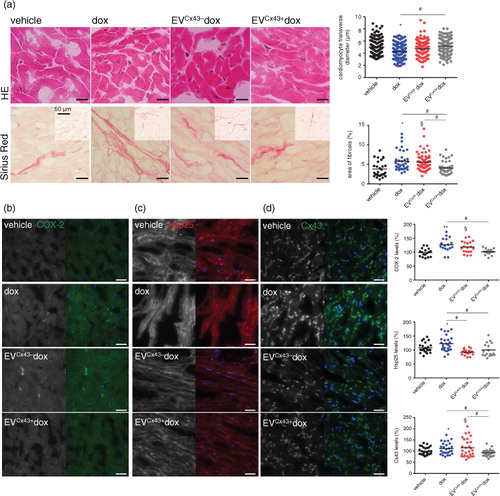
Fig. 6. Cx43-containing EVs ameliorate dox cardiotoxicity in vivo. Tumour-bearing mice were treated (i.t.) with 0.2 mg/kg of free dox, EVCx43 + dox or EVCx43 − dox 5 and 8 days after bilateral subcutaneous 4T1luc2 cells inoculation. At day 11, mice were sacrificed and hearts were collected. (a) Histological analysis of hearts was performed by HE and Sirius red staining. Scale bars, 5 µm. Insets represent low-magnification images. Quantitative measurements obtained in each field analysed by microscopy are depicted in the graph (n = 3–4, *p < 0.05 dox vs. vehicle; §p < 0.05 EVCx43 − dox vs. vehicle; #p < 0.05). Expression of COX-2 (green) (b) Hsp25 (red) (c) and Cx43 (green) (d) was assessed by immunofluorescence. Nuclei were stained with Dapi. Scale bars, 20 µm. Graphs depict quantification of each individual field analysed by fluorescence microscopy (n = 3–4, *p < 0.05, **p < 0.01 dox vs. vehicle; §p < 0.05 EVCx43 − dox vs. vehicle; #p < 0.05).