Figures & data
Fig. 1. Workflow of EV preparation and mass spectrometry. Mesenchymal stem cells (MSCs), glioblastoma cells (U87) and hepatocellular carcinoma cells (Huh7) were cultured, and EVs prepared on 6 different days by differential ultracentrifugation. Resulting samples (cells, microvesicles and exosomes, altogether 54 samples) were subjected to proteomic (27 samples, LC–MS/MS) and lipidomic (27 samples, MS/MSALL) analyses. Proteins were quantified by the label-free quantification method iBAQ (intensity-based absolute quantification, see details in materials and methods section). Analysis detected 3,531 proteins and 1,961 lipid species (defined by head group identity, length, saturation and number of fatty acid tails) in 22 lipid classes (defined by head group identity). Level of proteins and lipids in exosomes and microvesicles were later normalized to their respective source cells and expressed on a log(2) scale.
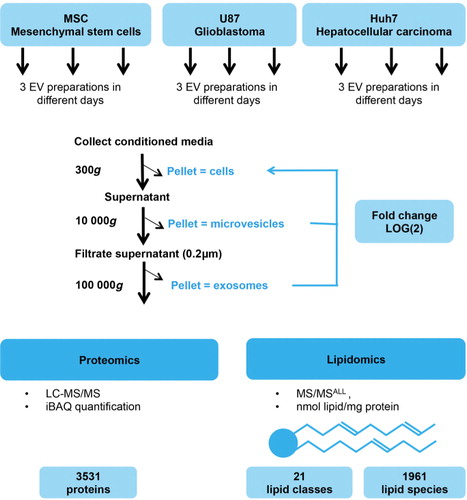
Fig. 2. Quality control of EV preparations. (a) Representative size distribution profiles of EVs from 3 different cell sources as obtained by Nanoparticle Tracking Analysis (NanoSight NS300, Malvern). Microvesicles were more heterogeneous in size independently of cell source. (b) EVs are depleted in proteins of nuclear or Golgi origin. Origin of proteins was identified by Scaffold Proteome Software. (c) Enrichment of exosomal marker proteins in EVs. Fold change of proteins in EVs versus source cells is colour-coded on a log(2) scale. Enrichment of established protein markers in exosomes was source-cell-type-dependent and most exosomal markers were, although to a lower extent, also enriched in microvesicles.
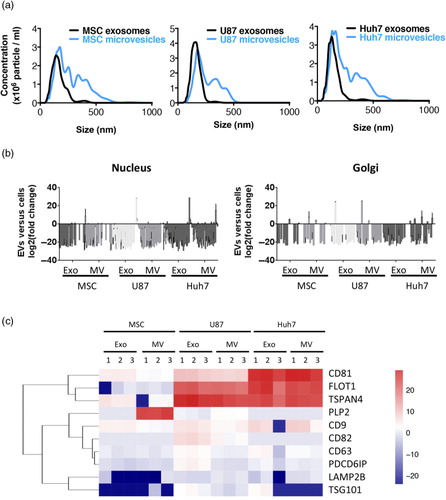
Fig. 3. Protein and lipid sorting into EVs are not linked. Pairwise Pearson's correlations of protein and lipid levels in cells, microvesicles and exosomes derived form 3 source cell types. Numbers represent R2. (a) Microvesicular proteome was more similar to the source cell than the exosomal proteome was in all 3 cell types investigated. (b) Cancer cell-derived proteomes (U87 and Huh7) were increasingly similar to each other and increasingly different from stem cell proteome (MSC) while moving from cells towards microvesicles and exosomes. (c) Principal component analysis of protein levels in exosomes (round) and microvesicles (square) normalized to their respective source cell. MSC-derived exosomes and microvesicles segregate from cancer cell EVs. (d) Lipidomes of exosomes, microvesicles and source cells are more similar to each other than their proteomes are. (e) Huh7 and MSC lipidomes showed increasing levels of similarity moving from source cells to microvesicles to exosomes. (f) Principal component analysis of lipid levels in exosomes (round) and microvesicles (square) normalized to their respective source cell. MSC- and Huh7-derived EVs increasingly cluster together and segregate from U87 moving from microvesicles to exosomes.
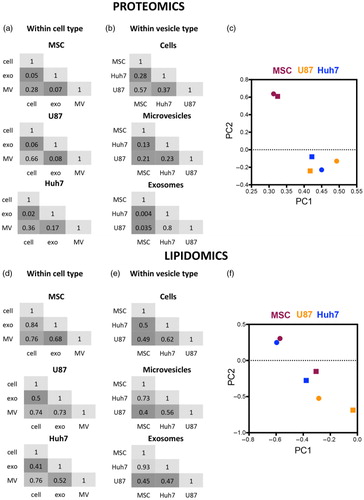
Fig. 4. Over-represented protein pathways depend on vesicle type. (a) Venn diagrams of detected proteins in exosomes and microvesicles of 3 different source cell types. MSC EVs had a lower diversity of proteins. (b) Proteins shared among exosomes or microvesicles derived from all 3 source cell types (middle section in the Venn diagrams) underwent gene ontology analysis. The negative logarithm of p-values is shown for each GO term, colourful lines represent significance threshold (p=0.05). Common (depicted in black), as well as distinct (depicted in colour) pathways emerged in exosomes versus microvesicles.
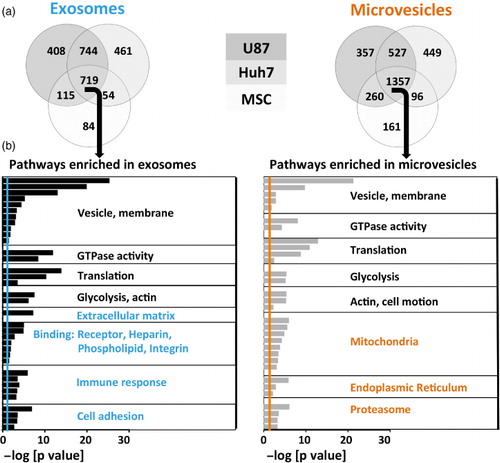
Fig. 5. Heatmap of all protein levels in EVs normalized to their respective source cells. iBAQ values of proteins in EVs were normalized to the corresponding protein levels in source cells, expressed on a log(2) scale and colour-coded. Depletion is depicted in blue and enrichment in red. Clusters from heatmap underwent gene ontology analysis, and terms significantly enriched are shown on the right. TM, transmembrane; ECM, extracellular matrix; ER, endoplasmic reticulum; CAM, cell adhesion molecule; VLDL, very low density lipoprotein; diS, disulphide.
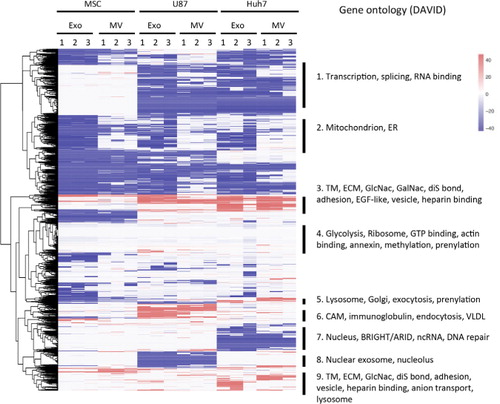
Fig. 6. Lipid enrichment in EVs correlates with head group charge and fatty acid tail length and saturation. Lipid species levels in EVs were normalized to the corresponding lipid levels in source cells, expressed on a log(2) scale and colour-coded. Depletion is depicted in blue and enrichment in red. Sidebar on the left encodes 3 characteristics of a lipid species: headgroup charge (in colour), average length of fatty acid tails (greyscale) and average level of saturation of fatty acid tails (greyscale). Lipid species clustered not only according to head group charge but also according to length and saturation of tails.
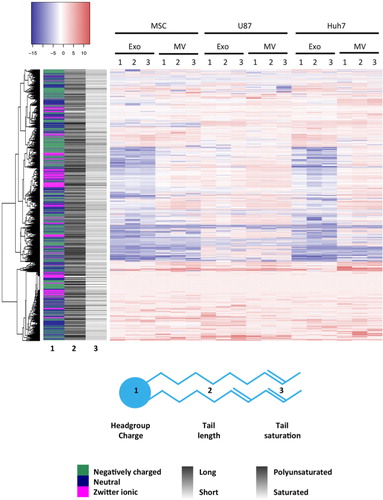
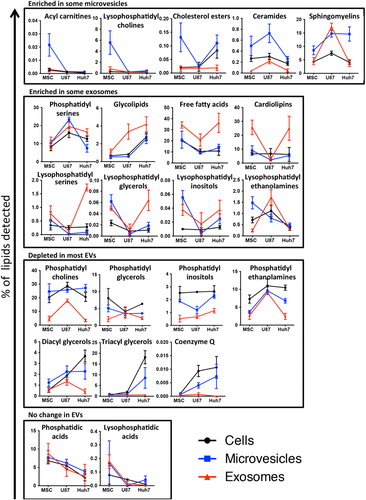
Fig. 7. Lipid class enrichment in EVs depends on vesicle type and source cell type. Percentage of each lipid class within a sample is depicted on slope charts and lipid class grouped according to their enrichment in microvesicles (upper panel), enrichment in exosomes (upper middle panel), depletion in most EVs (lower middle panel) or no difference between EVs and source cells (lower panel). Source cells are depicted in black, exosomes in red and microvesicles in blue. Since different lipid classes represent vastly different percentage of cells’ or vesicles’ lipid composition, the scale of the y-axes shows a corresponding variability.