Figures & data
Fig 1 S. gordonii CH1 forms robust dual species biofilms with C. albicans when inoculated simultaneously under conditions of salivary flow. Biofilms were allowed to develop in flow cells for 12–14 h in saliva-supplemented medium. Panel (a) depicts 3-D reconstructions of representative confocal images of biofilms. C. albicans SC5314 (green) was visualized after staining with an FITC-conjugated anti-Candida antibody. S. gordonii CH1 was visualized after fluorescence in situ hybridization (FISH) with a Streptococcus sp.-specific probe conjugated to Alexa 546. Panel (b) depicts the average biovolumes (in µm3) for each species as measured in eight different CLSM image stacks from two independent experiments. Bottom panel: S. gordonii=CH1, C. albicans=Ca. * indicates a p-value of less than 0.05 when S. gordonii mono-species biovolumes were compared to mixed-species biovolumes by t-test.
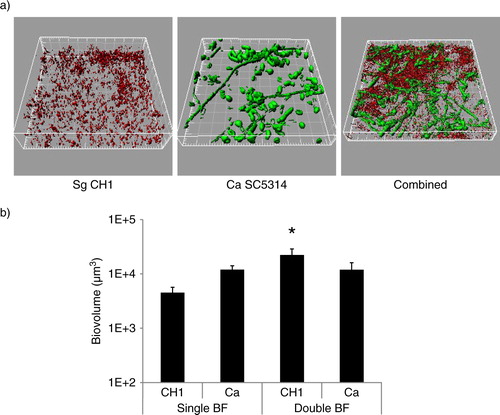
Fig 2 A gtfG deletion mutant has an attenuated dual biofilm phenotype. Dual biofilms of C. albicans SC5314 with an S. gordonii gtfG deletion mutant (strain AMS12, ΔGtf) or complemented (AMS12/pAMS40, Gtf+) strains were allowed to develop in flow cells for 12–14 h in saliva-supplemented medium. Panel (a) depicts 3-D reconstructions of representative confocal images of single and dual biofilms. C. albicans SC5314 (green) and S. gordonii (red) strains were visualized by immuno-FISH staining, as above. Panels (b,c) depict the average biovolumes (in µm3) for each strain separately in single and dual biofilms, as measured in eight different CLSM image stacks from two independent experiments. Bottom panel: C. albicans=Ca, mutant strain AMS12=ΔGtf, complemented strain AMS12/pAMS40=Gtf+. * indicates a p-value of less than 0.05 for a comparison between the mutant and complemented strains.
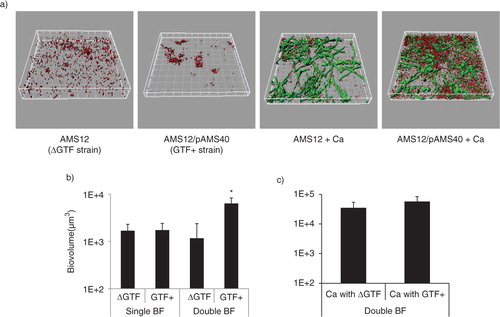
Fig 3 Sucrose promotes dual biofilm development under static conditions. C. albicans SC5314 (Ca) and S. gordonii CH1 (Sg CH1) were allowed to form single and dual static biofilms for 24 h, in 96 well plates, in salivary flow media supplemented with 1% sucrose (wt/vol), 1% glucose (wt/vol) or 1% PBS control (vol/vol). Biofilm biomass was measured using the crystal violet assay. *p=0.0002 and **p=0.005 for a comparison between sucrose and glucose.
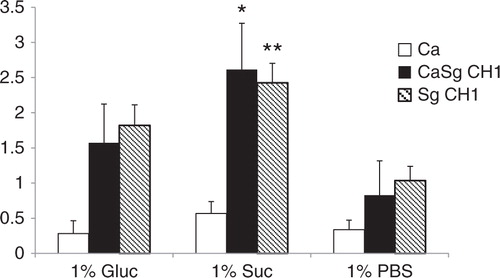
Fig 4 Sucrose promotes dual biofilm development under flow conditions. C. albicans SC5314 (Ca, green) and S. gordonii CH1 (Sg CH1, red) were allowed to form single and dual biofilms for 12–14 h in flow cells. Salivary flow media were supplemented with 1% sucrose (wt/vol), 1% glucose (wt/vol) or 1% PBS control (vol/vol). Biofilm biomass was measured using confocal imaging after immuno-FISH staining of C. albicans SC5314 and S. gordonii CH1, as described above. Panels (a,c) depict 3-D reconstructions of representative confocal images of single (a) and dual (c) biofilms. Panels (b,d) depict the average biovolumes (in µm3) of each microorganism in single (b) and dual biofilms (d). In panel b, C. albicans=Ca, S. gordonii CH1= Sg Ch1. In panel d, C. albicans+S. gordonii CH1=CaSgCH1. Panel (b): *p=0.002 and **p=0.003, for a comparison to glucose and PBS, respectively. Panel (d): *p=0.004 and **p=0.002, for a comparison to glucose and PBS, respectively.
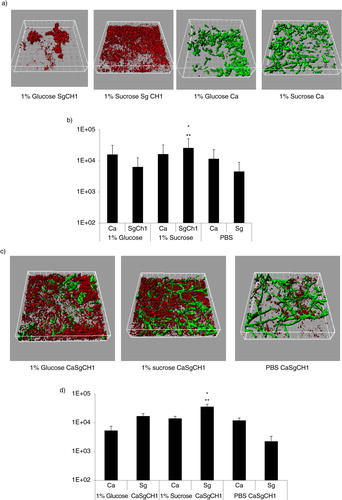
Fig 5 A gtfG deletion mutant has an attenuated C. albicans biofilm binding phenotype. S. gordonii CH1 wild type, mutant and complemented gtfG strains were tested in their ability to adhere to a preformed 4 h C. albicans biofilm in saliva-supplemented media. Panel (a) depicts S. gordonii wild type (CH1), mutant (ΔGtf) and complemented (Gtf+) (red) strains binding to C. albicans (green), after immuno-FISH staining. Bar=50 µm. Panel (b) depicts the mean ratio of red/green fluorescence signal in eight microscopic fields per condition, set up in duplicate, after image J quantification. *p=0.0003 and **p=0.04, for a comparison with wild type and complemented strains, respectively.
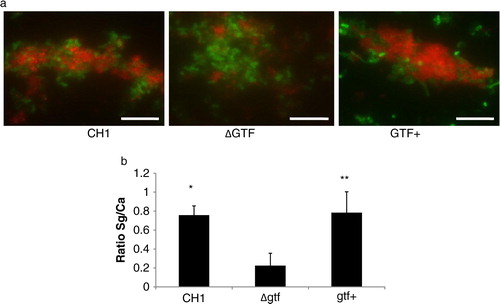
Fig 6 C. albicans enhances the ability of S. gordonii strain CH107 to form biofilms. Biofilms were allowed to develop in flow cells for 12–14 h in saliva-supplemented medium. Panel (a) depicts 3-D reconstructions of representative confocal images of biofilms with C. albicans SC5314 (green) and S. gordonii CH107 (red), stained with immuno-FISH as described above. Panel (b) depicts the average biovolumes (in µm3) for strain CH107 in single and double biofilms as measured in eight different CLSM image stacks from two independent experiments. Bottom panel: S. gordonii CH107= CH107, C. albicans=Ca. *p=0.009 compared to single-species biovolumes by t-test.
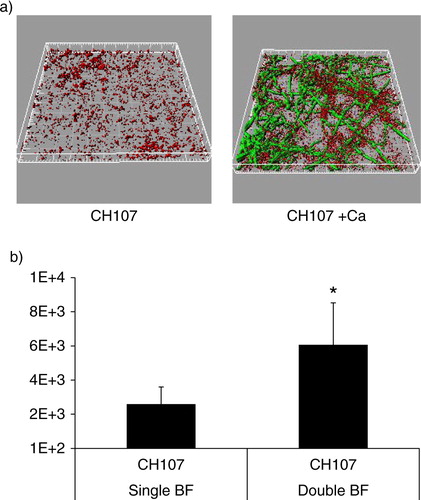
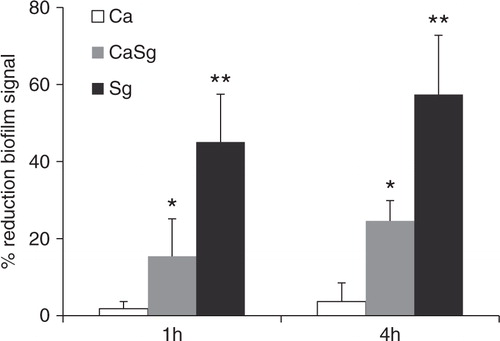
Fig 7 Dual S. gordonii–C. albicans biofilms are disrupted by dextranase digestion. Organisms were allowed to form single and dual species biofilms in 96 well plates for 24 h, in 1% sucrose-supplemented salivary flow media, and were subsequently digested by dextranase for 1 h or 4 h. The remaining biofilm mass was assessed by the crystal violet staining assay. Results represent mean percent reduction of biofilm signal, compared to buffer control. Means±SD of two independent experiments are shown, with each condition set up in triplicate. *p=0.04 and **p=0.02, for a comparison between the buffer and dextranase signals in dual S. gordonii–C. albicans (CaSg) and single S. gordonii (Sg) biofilms, respectively.