Figures & data
Table 1. Origin of the 183 investigated C. glabrata isolates including reference strains in the 10 clusters in the protein profile cluster dendrogram
Fig. 1. Protein profile cluster (Principal Component Analysis (PCA)) dendrogram of the 183 C. glabrata and reference strains grouped into 10 clusters based on proteomic profiling. The clusters are marked by color and numbered 1–10 (Maldi Biotyper Compass version 4.1).
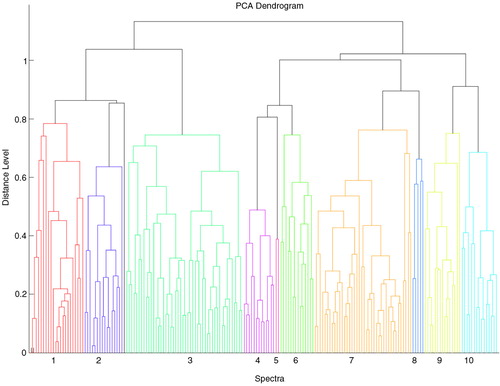
Table 2. Antimicrobial susceptibility of C. glabrata to five of the antifungals tested
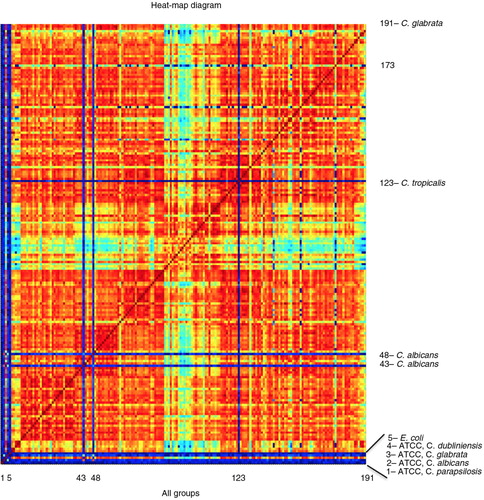
Fig. 2. CCI matrix of 183 C. glabrata isolates versus reference strains presented in a heat map diagram. Strains different from C. glabrata, expressed by dark blue lines, are marked by species names and protein profile numbers (different from sample numbers). The dark red diagonal line represents the intersections of identical groups. The diagram illustrates variation in protein spectra between C. glabrata and other species as well as among all isolates identified as C. glabrata in which blue and green shades represent distance between some of the protein spectra (Maldi Biotyper Compass version 4.1).