Figures & data
Fig. 1. Relative abundance of predominant species-level and genus-level probe targets. (a) Relative abundance of the 20 most predominant species-level probe targets in each group. (b) Relative abundance of the 10 most predominant genus-level probe targets in each group.
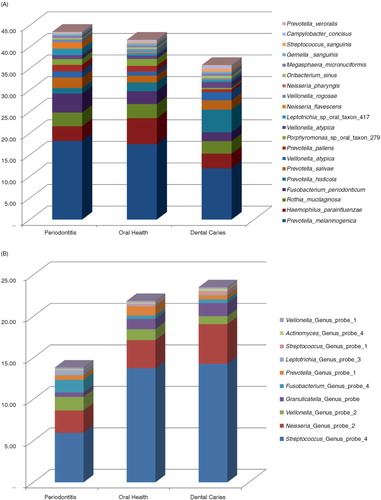
Fig. 2. Periodontitis- and dental caries–associated probe targets: Periodontitis- and dental caries–associated probe targets based on the frequency of detection in samples from periodontitis patients (white bars), dental caries patients (black bars), and orally healthy individuals (gray bars) (p<0.05).
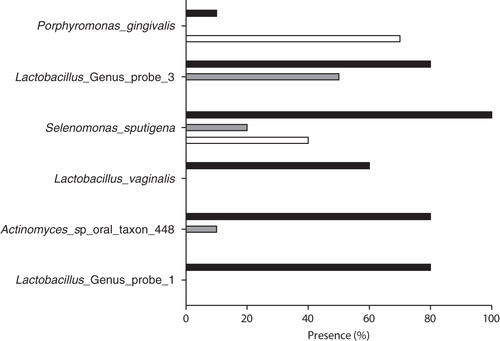
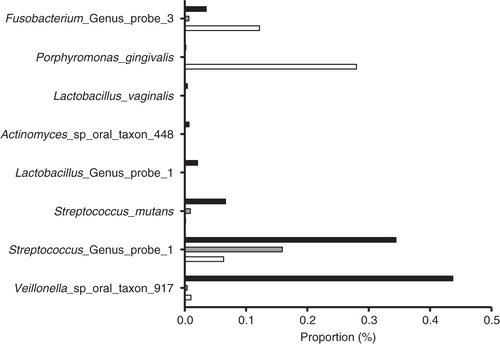
Fig. 3. Periodontitis- and dental caries–associated probe targets: Periodontitis- and dental caries associated–probe targets based on relative abundance in samples from periodontitis patients (white bars), dental caries patients (black bars). and orally healthy individuals (gray bars) (p<0.05).