
Figures & data
Fig. 1. Conceptual model of leadership for learning.
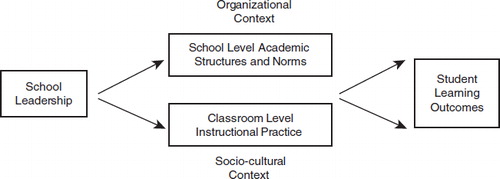
Fig. 2. Conceptual model of principal leadership, school capacity and student academic outcomes in an accountability context.
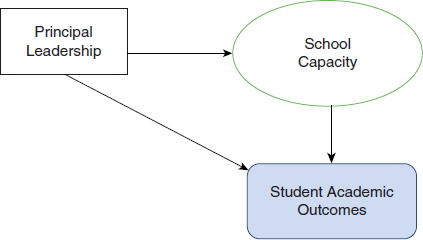
Table 1. Descriptive statistics and correlations for leadership dimensions and support for students.
Table II. Relative impact of leadership practices on support for students by Key Staff and general teachers.
Table III Multiple regression analysis results on various school capacity on Student Academic Outcomes (N=376; Key Staff of P4 schools).
Table IV Hierarchical regression results of principal leadership impact on math results (N=376, Key Staff).