Figures & data
Fig. 1 Location of the reindeer winter feeding experiment in the Hammastunturi herding cooperative (circle) and of the weather station in Saariselkä (star). In the upper map, the reindeer herding area in Finland is indicated in black.
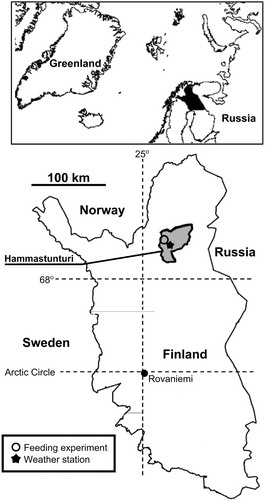
Table 1 The results of the analysis of grass silage produced in summer 2008 and 2009 and pellets used in the reindeer feeding experiment. The analysis was carried out by Viljavuuspalvelu Ltd. (Mikkeli, Finland).
Fig. 2 The mean (with standard error) coverage (%) of (a) faeces and (b) uneaten grass silage+hay in the feeding experiment after the first winter (2009) and the second (2010), n=10 plots per feeding practice.
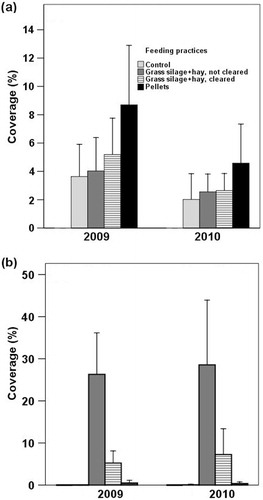
Fig. 3 The mean (with standard error) coverage (%) of (a) Empetrum nigrum, (b) Calluna vulgaris, (c) Vaccinium myrtillus, (d) Vaccinium vitis-idaea and (e) Deschampsia flexuosa in the field layer, and (f) all mosses and hepatics, (g) Pleurozium schreberi, (h) Dicranum sp. and (i) all lichens in the ground layer of a sub-xeric heath forest before the feeding experiment was started (2008), after the first winter (2009) and the second (2010). The figures for 2008 are starting means, and those for 2009 and 2010 covariate-adjusted means (2008 values as a covariate) for feeding practices. The different letters denote differences between the feeding practices at significance level P=0.05, n=10 plots per feeding practice.
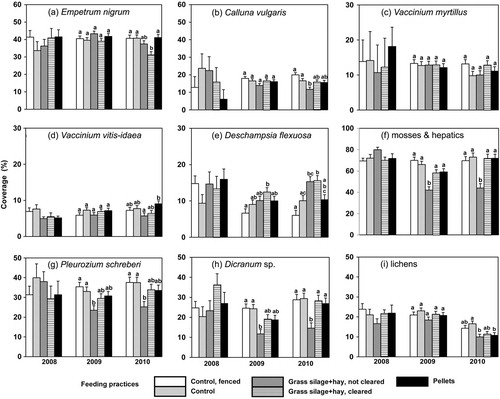
Table 2 F-tests of the effects of feeding practice (10 plots per feeding practice) and the year 2008 (data measured before the experiment was established) on the species coverage in the ground and field layer of the sub-xeric heath type forest after two winters of experimental feeding of reindeer in 2010.
Fig. 4 Mean (with standard error) N concentration (%) in leaves of (a) Empetrum nigrum and (b) Vaccinium vitis-idaea, and (c) C/N of soil on the plots in the sub-xeric heath forest before the feeding experiment was started (2008), after the first winter (2009) and after the second (2010). The figures for 2008 are starting means, and those for 2009 and 2010 covariate-adjusted means (2008 values as a covariate) for feeding practices. The different letters denote differences between the feeding practices at significance level P=0.05, n=10 plots per feeding practice.
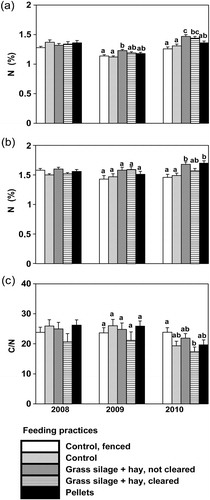
Table 3 F-tests of the effects of feeding practice (10 plots per feeding practice) and year 2008 (data measured before the experiment was established) on N concentration (%) and C/N in E. nigrum, V. myrtillus and soil, and soil pH after two winters of experimental feeding of reindeer in 2010, as well as the multiple comparisons (Tukey–Kramer method) of the covariate-adjusted feeding practice means.