
Figures & data
Fig. 1 Upper layer circulation in the Nordic seas and Arctic Ocean. Warm Atlantic inflow is shown with red solid lines, Arctic outflow with dashed red lines (A. Beszczynska-Möller, pers. comm.).
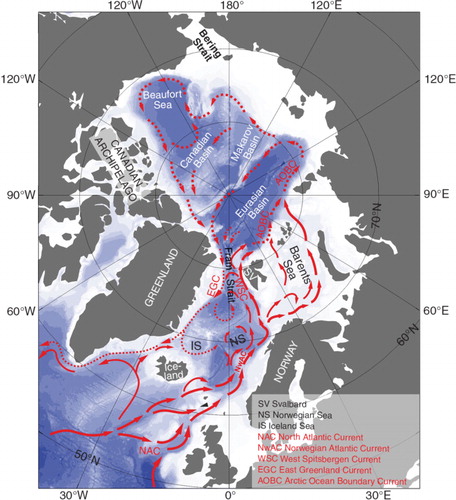
Fig. 2 The major internal pools and fluxes within the surface ocean, through which carbon can circulate: dissolved inorganic carbon (DIC), dissolved organic carbon (DOC), particulate organic carbon (POC) and particulate inorganic carbon (PIC); see for details of the fluxes. The numbers in brackets in each box relate to the list of the five main carbon pools described in the text. Higher trophic level is abbreviated to HTL.
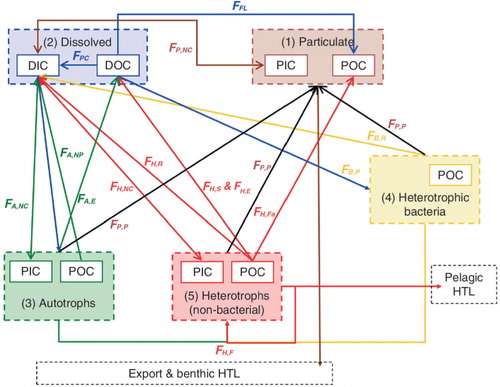
Table 1 Summary of pools and processes within the Arctic Ocean surface waters. Names and abbreviations are provided, as well as the source and sink pools (i.e., where carbon is transferred from and to) associated with each process.
Fig. 3 Mean monthly conditions for (a) incident photosynthetically active radiation (PAR), (b) air temperature (at 2 m), (c) wind speed, (d) sea surface temperature (SST), (e) sea-ice concentration, and (f) mixed layer depth (MLD) for each of the four case study regions. Data are averaged for the regions—Atlantic-influenced shelves (AiS), Pacific-influenced shelves (PiS), river-influenced shelves (RiS), and central basins (CB)—for the period 1979–2013 (for ice, air temperature and PAR, SST and wind speed) using National Centers for Environmental Prediction reanalysis data provided by the Physical Sciences Division of the Earth System Research Laboratory (National Oceanic and Atmospheric Administration) in Boulder, CO, from their website (http://www.esrl.noaa.gov/psd/) and for the period 1961–2008 for MLD, using MLD density-calculated climatology from de Boyer Montegut et al. (Citation2004).
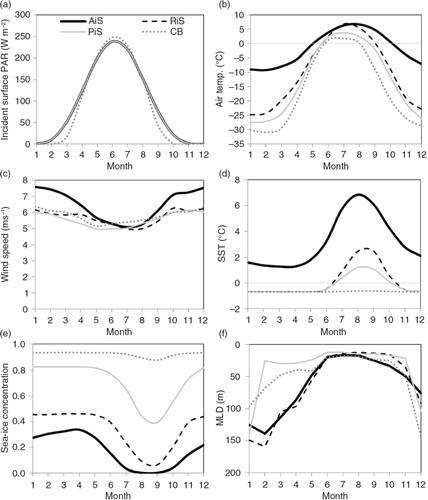
Fig. 4 (a) Relative fluxes of abiotic carbon into the Arctic Ocean (AO) over an average year from the main water inflows: Pacific Water (PW); Atlantic Water (AW) river water (RW). (b–d) relative flux of dissolved inorganic carbon (DIC), particulate inorganic carbon (PIC), dissolved organic (DOC) and particulate organic carbon (POC) into each of the focus regions within the AO: (b) Pacific-influenced shelves, (c) Atlantic-influenced shelves and (d) river-influenced shelves. Note the scales are different on the y-axis and PIC is estimated from a constant PIC:POC ratio of 0.67 (Striegl et al. Citation2007; McGuire et al. Citation2009).
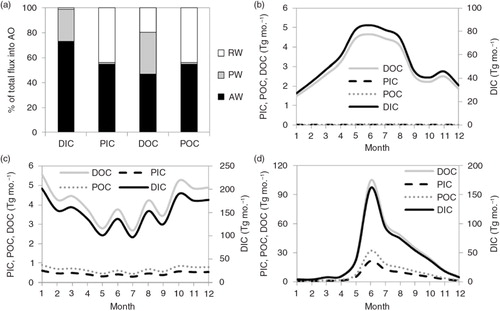
Fig. 5 Relative size of extant (using data available in the literature between the years 1990 and 2013) pools and fluxes at each of the Arctic Ocean regions: (a) Pacific-influenced shelves, (b) Atlantic-influenced shelves, (c) river-influenced shelves and (d) the central basins. The pools include dissolved inorganic carbon (DIC), dissolved organic carbon (DOC), particulate organic carbon (POC) and particulate inorganic carbon (PIC), with the area of these boxes representing by the relative concentrations in µmol kg−1 (except for PIC, where no data are available) and autotrophs (A), heterotrophs (H) and bacteria (B), with the size of these boxes representing the relative biomass in g C m−2. Solid lines indicate fluxes for which there are data available, and are relative sizes in mg C m−2 d−1, except for the atmospheric CO2 flux which is provided in Tg C y−1. Dashed lines indicate fluxes where data are unavailable. Higher trophic level is abbreviated to HTL.
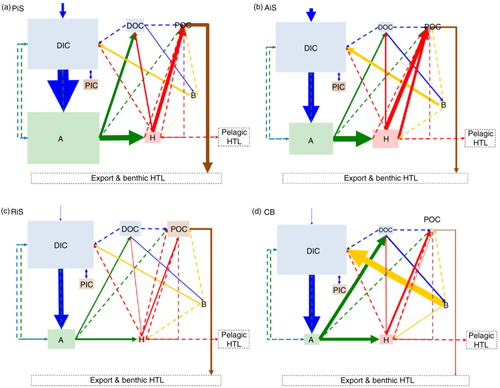
Fig. 6 Anomalies in (a) air temperature (AT), (b) sea-surface temperature (SST), and (c) ice cover (%) since 1979, relative to the 1979–2013 mean, for each of the Arctic ocean regions: Pacific-influenced shelves (PiS), Atlantic-influenced shelves (AiS), river-influenced shelves (RiS) and central basins (CB). Data are National Centers for Environmental Prediction reanalysis data provided by the Physical Sciences Division of the Earth System Research Laboratory (National Oceanic and Atmospheric Administration) in Boulder, CO, via the website http://www.esrl.noaa.gov/psd/.
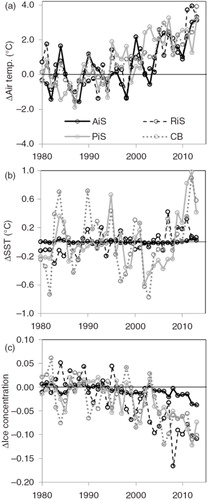
Table 2 Ranges of values for each of the processes (flux as listed in ), as available from the literature, for Pacific-influenced shelves (PiS), Atlantic-influenced shelves (AiS), river-influenced shelves (RiS) and central basins (CB).
Table 3 The potential impacts of change on physical, biogeochemical and ecological systems and the consequences for the carbon cycle, highlighting the regions—Pacific-influenced shelves (PiS), Atlantic-influenced shelves (AiS), river-influenced shelves (RiS) and central basins (CB)—most affected by each aspect.