Figures & data
Table 1. Analytical result on chemical constituents in PM1 (this study)
Fig. 1 Temporal variability of: (a) PM1; (b, c) mass fractions of metals and water-soluble inorganic species (WSIS) and (d) K (fine-mode) mass concentration.
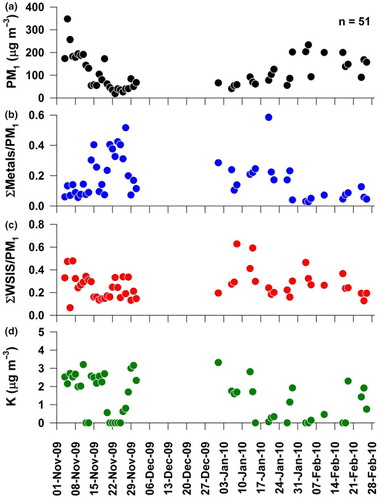
Fig. 2 Temporal variability of: (a) ammonium-to-sulphate equivalent ratio and (b) nitrate-to-sulphate mass ratio.
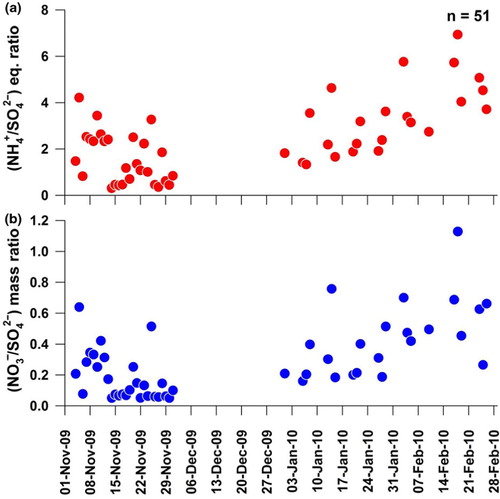
Fig. 3 Spatial variability in chemical composition of WSIS (here SWSIS=
![]()
![Fig. 3 Spatial variability in chemical composition of WSIS (here SWSIS= Display full size+ Display full size+ Display full size+ Cl−) in PM1 from some of the urban, rural, coastal and high-altitude locations. Also shown is the nitrate-to-sulphate mass ratio for these locations. Mass concentration of ∑WSIS [given in brackets] is in µg m−3.](/cms/asset/14ac0535-4935-4444-9344-a016dd21f952/zelb_a_11827484_f0003_ob.jpg)
Fig. 4 PMF analysis showing: (a) Species labelled as strong and weak (arbitrary scale on Y-axis) based on residual and regression analyses. Species with asterisk (As and Co) represent the bad species. (b) Variability of Q-Robust as a function of run number.
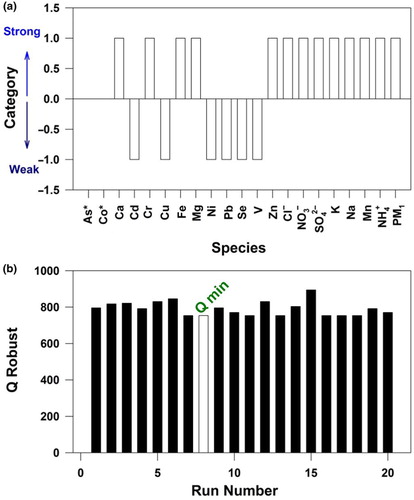
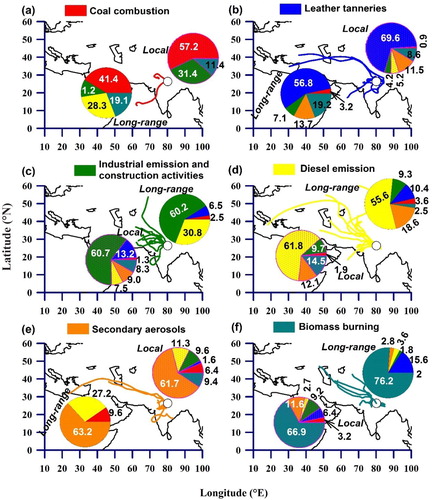
Fig. 5 PMF-based percentage contribution of resolved factors in PM1.
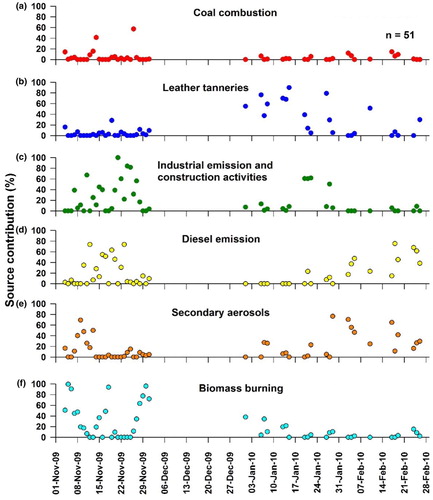
Fig. 6 Percentage contribution of resolved sources in conjunction with air-mass back trajectories (5 d; 1000 m above mean sea level) on sampling days at Kanpur (shown by a circle) shows the predominance of: (a) coal combustion; (b) leather tanneries; (c) industrial emission and construction activities; (d) diesel emission; (e) secondary aerosols and (f) biomass burning emissions.