Figures & data
Figure 1. Raman spectra of the three single wall carbon nanotubes [Citation47], and UV-Vis-NIR spectra of the three single wall carbon nanotubes dispersed in 0.1% (w/v) gemini surfactant solution before and after centrifugation.
Cent: Centrifuged sample; M: Metallic; S: Semiconducting.
![Figure 1. Raman spectra of the three single wall carbon nanotubes [Citation47], and UV-Vis-NIR spectra of the three single wall carbon nanotubes dispersed in 0.1% (w/v) gemini surfactant solution before and after centrifugation.Cent: Centrifuged sample; M: Metallic; S: Semiconducting.](/cms/asset/c4ad8819-bdd4-4e8c-94b1-3cf9a4b07d98/ifso_a_12363820_f0001.jpg)
Figure 2. Characteristics of gemini 12–3–12 surfactant modified single wall carbon nanotubes-siRNA complexes.
(A) Computer-generated images of representative M (9,9), and S (11,7) single wall carbon nanotubes; (B) structure of gemini surfactant 12–3–12; (C) puretubes, Isonanotubes-M and Isonanotubes-S single wall carbon nanotubes (0.1 mg/ml) dispersions in 0.1% (w/v) 12–3–12 G; (D) high-resolution electron micrographs of gemini-Isonanotubes-M and gemini-Isonanotubes-S complexes showing individually dispersed nanotubes.
G: Gemini surfactant; M:Metallic; S: Semiconducting.
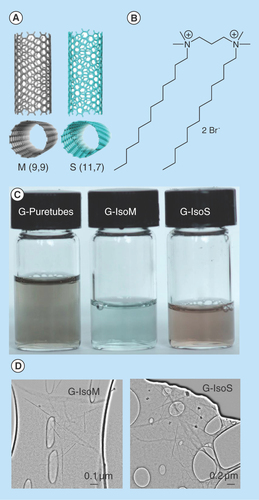
Figure 3. Uptake of G-single wall carbon nanotubes-siRNA complexes into PAM212 keratinocytes.
(A) Cells were imaged using confocal microscopy following 1, 8 and 24 h of incubation (columns). (I) Puretubes; (II) IsoM; and (III) IsoS complexes. Column 4 shows the corresponding profile view of fluorescence distribution along the indicated red line section of the 24 h micrographs. Fluorescence in columns one and two is as follows; red – siGLO-RNA, green – calcein viability stain. In column three, blue fluorescence is pseudocolor – DRAQ5 nuclear/DNA stain, pink – colocalization (red and blue). Arrows indicate accumulation in the nuclei/nucleoli. Bar: 20 µm for all micrographs. (B) Colocalization analyses in confocal images of cells using the JACoP plugin of ImageJ. The PCC was calculated for at least five images per treatment and the average calculated values for each condition were plotted on the histogram (error bars represent SD). **Significant in comparison with siRNA (image shown in : free siRNA, 24 h), **p value < 0.001, *p < 0.05.
PCC: Pearson's correlation coefficient.
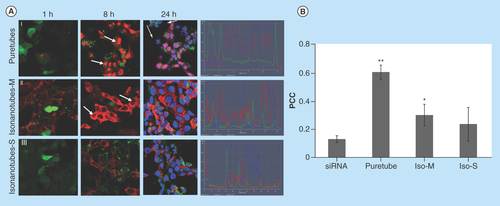
Figure 4. Imaging flow-cytometry analysis of G-single wall carbon nanotubes-siRNA distribution in PAM212 keratinocytes.
ImageStream multispectral imaging of PAM212 keratinocytes incubated with G-IsoM-siRNA (A) and G-IsoS-siRNA (B) complexes indicated colocalization of IsoM-siRNA with the nucleus. Similarity algorithm of the IDEAS software was used to measure the spatial colocalization of siRNA with the nuclei of cells where colocalization is present when a score between 1 and 2, or higher is obtained. The Mean Similarity Score for IsoM and IsoS complexes was 1.487 and 0.2983, respectively, after incubation of cells with the complexes at 37°C.
BF: Bright field; IsoM: Isonanotubes-metallic; IsoS: Isonanotubes-semiconducting.
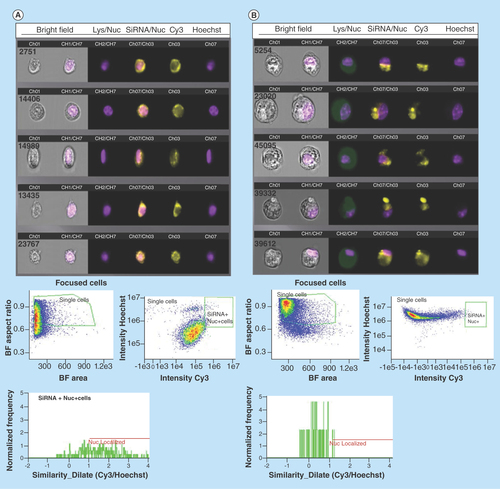
Figure 5. Uptake of siRNA into PAM212 keratinocytes in control preparations.
Conditions for transfection are identical to those described in . (A) no treatment, 24 h; (B) free siRNA, 24 h; (C) G-IsoM/IsoS 30:70-siRNA, 24 h (arrows indicate uptake into the nuclei); (D) free 12–3–12 gemini surfactant, 24 h; (E) siRNA in 0.1% (w/v) 12–3–12 gemini surfactant solution, 1 h; (F) siRNA in 0.1% (w/v) 12–3–12 gemini surfactant solution, 24 h.
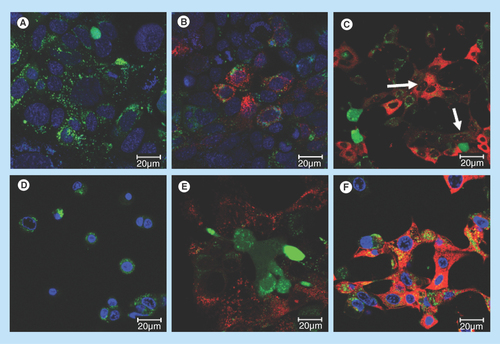
Figure 6. Uptake of G-single wall carbon nanotubes-siRNA complexes into purified nuclei.
(A) Nuclei were imaged using confocal microscopy following 24 h of incubation with (i) free siRNA, (ii) gemini-siRNA, (iii) G-Puretubes-siRNA, (iv) G-Isonanotubes-M-siRNA and (v) G-Isonanotubes-S-siRNA complexes. Dashed arrows represent siRNA (red) outside of nucleus and bold arrows represent colocalization of siRNA into the nucleus (pink). (B) Colocalization analyses in confocal z-stack images of nuclei using Huygens Pro software. PCC was calculated for at least five images per treatment and the average calculated values for each condition were plotted on the histogram (error bars represent ±SD). *Significant in comparison with free-siRNA, p value < 0.05. Bar: 10 μm for all micrographs.
Gemini: Gemini surfactant; IsoM: Isonanotubes metallic; IsoS: Isonanotubes semiconducting; PCC: Pearson's correlation coefficient.
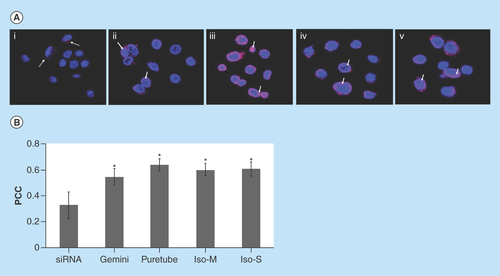
Figure 7. Simulation of G-single wall carbon nanotubes-siRNA complexes.
Packing of gemini surfactant 12–3–12 on the surface of (A) S (11,7) and (C) M (9,9) single wall carbon nanotubes. Binding of siGLO-RNA onto the surface of (B) the gemini functionalized S (11,7) and (D) M (9,9) single wall carbon nanotubes following 10 ns of molecular dynamics.
M: Metallic; S: Semiconducting.
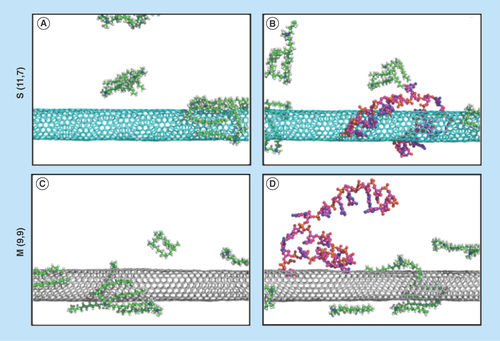
Figure 8. High-resolution transmission electron micrographs of single wall carbon nanotubes-siRNA complexes.
(A) Semiconducting G-Isonanotubes-S complex and (C) metallic G-Isonanotubes-M complex and (B) semiconducting gemini-IsoS-siRNA and (D) metallic G-Isonanotubes-M-siRNA. Insets in (A) and (D), represent additional images taken for those samples. Arrows indicate the wrapping pattern of gemini surfactant or siRNA around (A&B) semiconducting nanotubes and (C&D) metallic nanotubes.
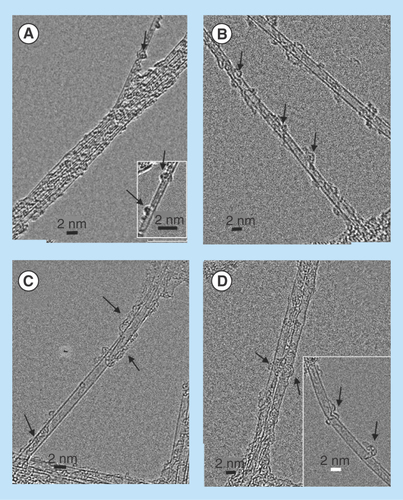
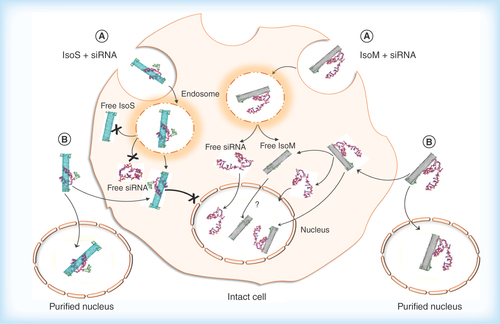
Figure 9. Hypothesized cellular uptake of metallic Isonanotubes-M-siRNA and semiconducting Isonanotubes-S-siRNA complexes, the release of siRNA inside the cell and its nuclear translocation based on consideration of experimental data.
(A) Endocytosis-dependent and (B) endocytosis-independent pathways have been postulated as possible uptake mechanisms. After internalization via pathway A or B, the endosomal or cytosolic environment favors the dissociation of siRNA from IsoM, but not IsoS, due to the weak noncovalent interaction between siRNA and IsoM single wall carbon nanotubes. IsoS nanotubes are wrapped more tightly by siRNA and it may not dissociate from IsoS nanotubes inside the cell after either endosomal escape or nonendocytotic uptake. The IsoM-siRNA complex is taken up by a nonendocytotic process and the released siRNA from IsoM after endosomal escape could translocate to the nucleus. Contrary to the IsoM complex, the delivery of IsoS-siRNA complex into the nucleus is inhibited in intact cells, possibly through an unknown cytoplasmic pathway which is not present in purified nuclei. In the absence of specific labeling of the nanotubes themselves, the nuclear translocation of free IsoM nanotubes is uncertain and will need further examination.
IsoM: Isonanotubes metallic; IsoS: Isonanotubes semiconducting.