
Figures & data
Figure 1. Demonstration of the pluripotency of the ovine stromal mesenchymal stem cell preparation used in this study.
Morphological appearance of the mesenchymal stem cell preparation in monolayer culture (A) and demonstration of mesenchymal stem cell multipotency over passage 8 (B–D) and passage 11 (E–G). Toluidine blue-stained cell pellets (B & E), induction of an osteogenic phenotype using OsteoDiff selection media, calcium deposition evident by Alizarin Red staining (C & F). Induction of an adipogenic phenotype in monolayer cultures in adipogenic selection media with characteristic fat droplet accumulation revealed by oil red-O staining (D & G).
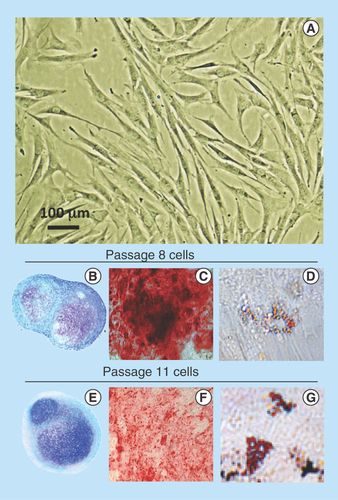
Figure 2. Histological localization of sulphated proteoglycan by toluidine blue staining and immunolocalization of aggrecan, type I collagen and type II collagen in sections of pellets cultured under basal culture conditions (ChondroDiff media) (A) and media supplemented with FGF-2 (B) or FGF-18 (C).
Acan: Aggrecan; Coll 1: Type 1 collagen; Coll 2: Type 2 collagen.
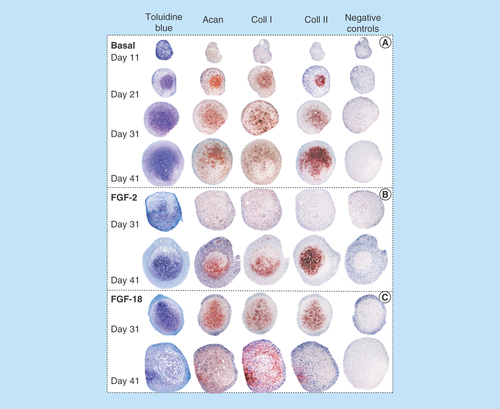
Figure 3. Immunolocalization of decorin (A–H) and biglycan (I–P) in micromass pellet cultures in basal medium (days 21 and 41) and in media supplemented with FGF-2 or -18. Rows (E–H) and (M–P) represent negative control sections for the specimens above them. The boxed areas indicated are shown at higher magnification in .
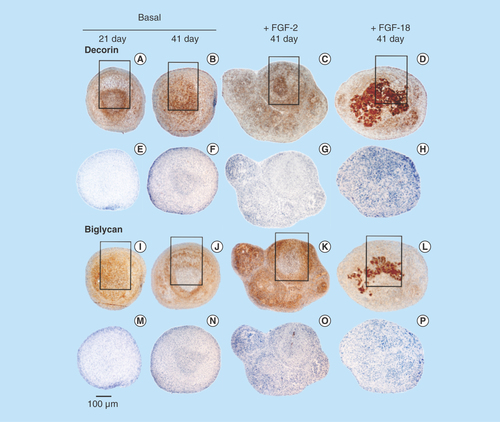
Figure 4. Higher power images of decorin and biglycan immunolocalizations of the boxed areas of interest in .
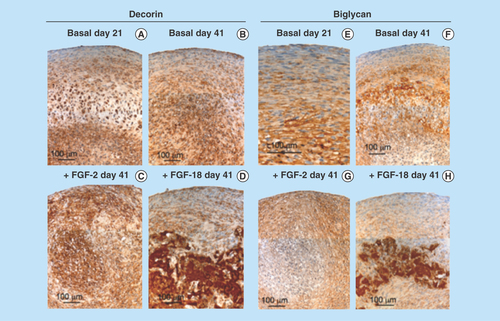
Figure 5. Immunolocalization of perlecan in micromass cell pellets of the ovine bone marrow mesenchymal stem cell from basal days 21 (A) and 41 (C) cultures and those supplemented with FGF-2 or -18 (day 41 samples only [B & D]).
An area of hypertrophic cells deep in the cell pellet is indicated in (B) and (D). FGF-2 (E) and -18 pellets (G) were significantly larger than the cell pellets cultured in basal media. The boxed areas in (E & G) are presented at higher magnification in (F & H).
![Figure 5. Immunolocalization of perlecan in micromass cell pellets of the ovine bone marrow mesenchymal stem cell from basal days 21 (A) and 41 (C) cultures and those supplemented with FGF-2 or -18 (day 41 samples only [B & D]).An area of hypertrophic cells deep in the cell pellet is indicated in (B) and (D). FGF-2 (E) and -18 pellets (G) were significantly larger than the cell pellets cultured in basal media. The boxed areas in (E & G) are presented at higher magnification in (F & H).](/cms/asset/6bd5cb1f-284a-4ccc-b722-638a1a7aa779/ifso_a_12363937_f0007.jpg)
Figure 6. Higher power images of selected areas in the pellets presented in demonstrating differences in the cellular organization in the pellets cultured under basal conditions or with FGF-2 or -18.
The cells in the pellet periphery are more flattened and smaller than cells deeper in the cell pellet, perlecan is prominently localized pericellularly in both cell type (A & B). In FGF-2 cultures the outermost cells of the pellets (C) express more perlecan than the inner cells (D). Decorin is also immunolocalized pericellularly around the peripheral (E) and deep cells (F) of the FGF-2 pellets; however, in the FGF-18 cultured cell pellets decorin is expressed by peripheral cells in the pellet (G) as well as being highly expressed around irregularly shaped extracellular matrix components (H). Scale bars 100 μm. The red chromogen used is Nova Red, the brown chromogen is diaminobenzidine, cell nuclei counterstained with hematoxylin (blue).
Dec: Decorin; Pln: Perlecan.
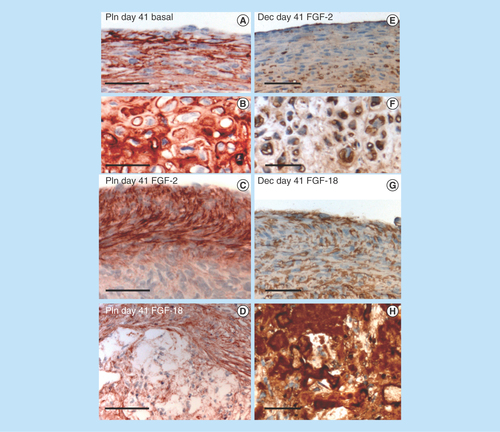
Figure 7. Demonstration of calcium deposition centrally in an FGF-18 cell pellet using Alizaran Red staining of the pellet section (A). The CS sulphation motifs 7D4 (B) and 4C3 (C) are also depicted localizing to a similar area as the calcium deposition. Segments are serial sections through the same cell pellet. Higher power images of the boxed areas in (A–C) are provided in segments (D–F).
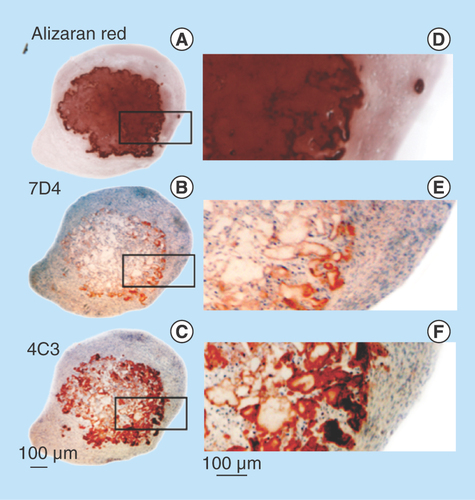
Figure 8. Quantitative-reverse transcription-PCR of anabolic and catabolic matrix genes, and transcription factors using total RNA isolated from cell pellets of the basal, FGF-2 and -18 cultured ovine mesenchymal stem cells.
Box plots are presented. Mean values of six replicates are indicated by a solid bar, the upper and lower ranges of the values are also shown.
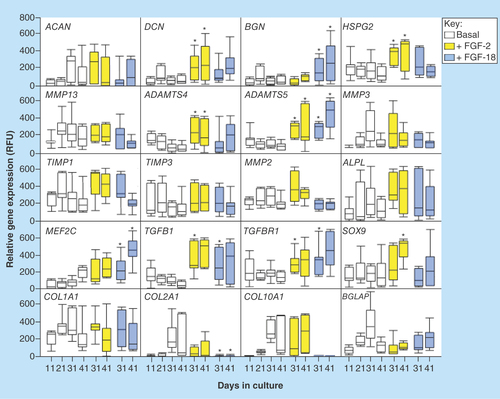
Figure 9. (A) Schematic depiction of the progressive changes in chondrocyte morphology through differentiation in the growth plate, and the chondrogenic and osteogenic genes, and the differentiation stages they affect. (B) Immunolocalization of FGF-2 pericellularly in articular chondrocytes and FGF-18 in the femoral epiphyseal growth plate clearly delineate the hypertrophic cells. (C) Summary of the anabolic and catabolic genes and transcription factors regulated by FGF-2 and -18 in pellet cultures of mesenchymal stem cells. NSD change not statistically different from basal conditions although and upward or downward trend may be evident as indicated.
*Upward trend but not statistically significant.
**Downward trend but not significantly significant
AC: Articular cartilage; GP: Growth plate; NSD: Not significantly different; OC: Ossification center.
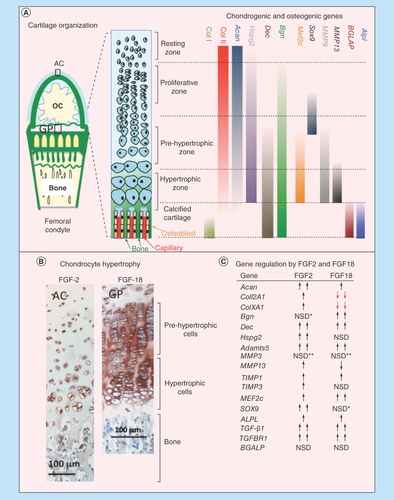
Figure 10. Immunolocalization of FGF-2 expressed by articular and growth plate chondrocytes in a newborn ovine hip (A) and femoral condyle (C) and tibial plateau (E) of the knee. FGF-2 is a pericellular component of articular chondrocytes (B, D) and epiphyseal growth plate chondrocytes (F). FGF-2 is also strongly expressed in bone marrow (A, C & E).
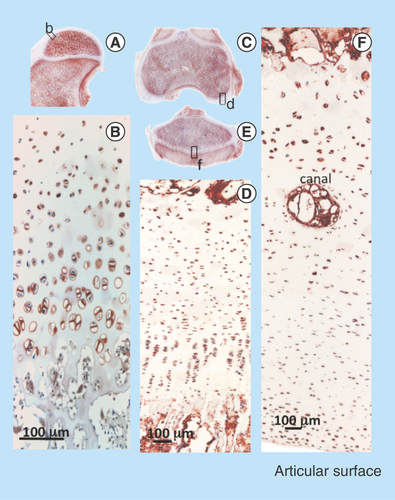
Figure 11. Immunolocalization of FGF-18 expressed by articular and growth plate chondrocytes in the hip (A) femoral condyle (E) and tibial plateau of the knee (G). Perlecan is particularly prominently expressed by the deep hypertrophic chondrocytes in articular cartilage (F) and the columnar hypertrophic chondrocytes of the growth plates of the femur and tibia (H).
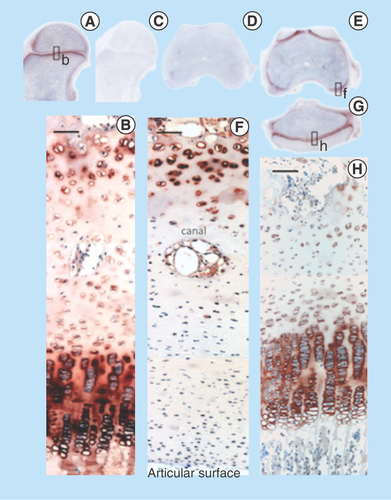
Table 1. Validated ovine primers used for reverse transcription PCR analyses.