Figures & data
Figure 1. Schematic representation of the synthesis, characterization and antibacterial application of nickel-prussian blue@silver nanocomposite.
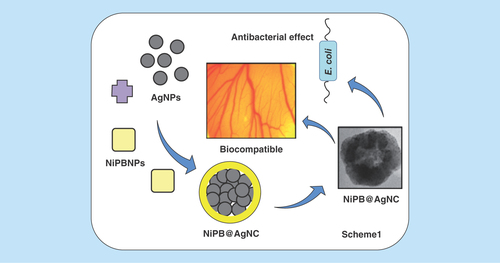
Figure 2. Characterization techniques of nanocomposite.
(A) UV–visible spectrum of K3Fe(CN)6, AgNPs, NiPB@AgNC-1 and NiPB@AgNC-2; (B) optical color images of K3Fe(CN)6, AgNPs, NiPB@AgNC-1 and NiPB@AgNC-2; (C & D) x-ray diffraction pattern of NiPB@AgNC and NiPBNPs and (E & F) transmission electron microscopy images of NiPB@AgNC and NiPBNPs, (G) DLS size (hydrodynamic diameter in nm) and (H) zeta potential (in mV) of NiPB@AgNC.
AgNP: Silver nanoparticle; DLS: Dynamic light scattering; NiPB@AgNC: Nickel-prussian blue@silver nanocomposite; NiPBNP: Nickel-prussian blue nanoparticle.
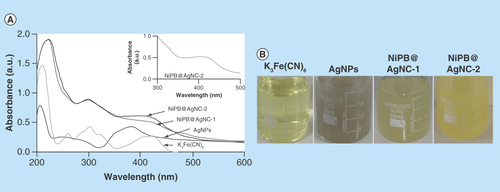
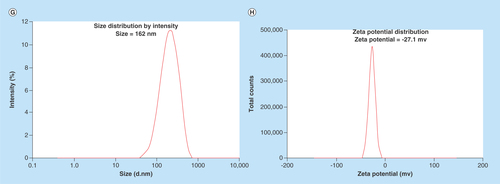
Figure 3. FTIR and stability studies.
(A) FTIR spectra of nickel-prussian blue@silver nanocomposite and (B) stability studies of nickel-prussian blue@silver nanocomposite in different physiological buffers and solutions.
FTIR: Fourier transformed infrared.
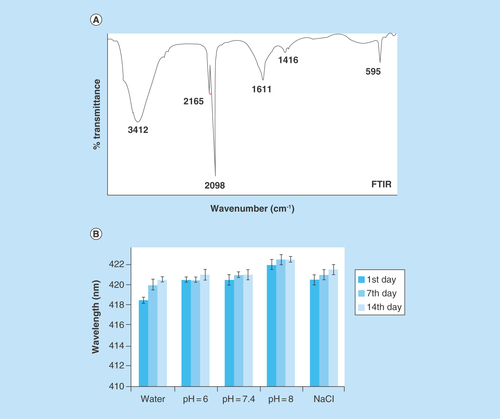
Table 1. Hydrodynamic diameter of nickel-prussian blue@silver nanocomposite in different buffers in a time-dependent manner to check the stability.
Figure 4. In vitro cytotoxicity of nanocomposite.
Cell viability assay of nickel-prussian blue@silver nanocomposite in (A) EA.hy926 (E9), (B) A549 and (C) B16F10 with different doses in for 24 h using 3-(4,5-Dimethylthiazol-2-yl)-2,5-diphenyltetrazolium bromide reagent. Numerical values indicate the volume of nickel-prussian blue@silver nanocomposite in μl/ml (where 1, 2.5, 5 and 7.5 μl/ml correspond to [Ag] = 14, 35, 70 and 105 μM, respectively).
![Figure 4. In vitro cytotoxicity of nanocomposite.Cell viability assay of nickel-prussian blue@silver nanocomposite in (A) EA.hy926 (E9), (B) A549 and (C) B16F10 with different doses in for 24 h using 3-(4,5-Dimethylthiazol-2-yl)-2,5-diphenyltetrazolium bromide reagent. Numerical values indicate the volume of nickel-prussian blue@silver nanocomposite in μl/ml (where 1, 2.5, 5 and 7.5 μl/ml correspond to [Ag] = 14, 35, 70 and 105 μM, respectively).](/cms/asset/0165bcb5-11d4-4812-b2c4-c45c44bc3125/ifso_a_12364026_f0006.jpg)
Figure 5. Confocal cell images of NIH-3T3 cells stained with DAPI and Alexa Fluor 488 phalloidin.
(A–D) NIH-3T3 cells were kept as untreated. (A) Merged images of all filters, (B) DAPI stained for nucleus of untreated cell, (C) Alexa Fluor 488 phalloidin staining for actin filaments and (D) merged images of blue and green filter of untreated cells. (E–H) Confocal images of NIH-3T3 cells were incubated with NiPB@AgNC (7.5 μl/ml corresponds to [Ag] = 105 μM) for 24 h). (E) Merged images of all filters, (F) DAPI stained for nucleus, (G) Alexa Fluor 488 phalloidin staining for actin filaments and (H) merged images of blue and green filter.
NiPB@AgNC: Nickel-prussian blue@silver nanocomposite.
![Figure 5. Confocal cell images of NIH-3T3 cells stained with DAPI and Alexa Fluor 488 phalloidin.(A–D) NIH-3T3 cells were kept as untreated. (A) Merged images of all filters, (B) DAPI stained for nucleus of untreated cell, (C) Alexa Fluor 488 phalloidin staining for actin filaments and (D) merged images of blue and green filter of untreated cells. (E–H) Confocal images of NIH-3T3 cells were incubated with NiPB@AgNC (7.5 μl/ml corresponds to [Ag] = 105 μM) for 24 h). (E) Merged images of all filters, (F) DAPI stained for nucleus, (G) Alexa Fluor 488 phalloidin staining for actin filaments and (H) merged images of blue and green filter.NiPB@AgNC: Nickel-prussian blue@silver nanocomposite.](/cms/asset/42cbcb78-4813-470c-ac8f-0ee2da4b8dfc/ifso_a_12364026_f0007.jpg)
Figure 6. Ex vivo chicken embryonic angiogenesis assay in presence of nickel-prussian blue@silver nanocomposite at different doses (with respect to silver concentration) in a time-dependent manner.
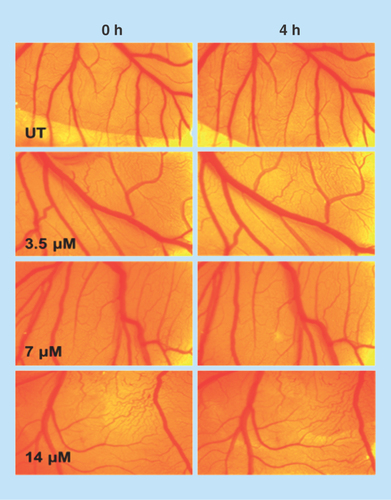
Figure 7. Antibacterial activity of nanocomposite.
Liquid growth inhibition kinetics of (A)Escherichia coli and (B)Bacillus subtillus using different volumes of nickel-prussian blue@silver nanocomposite. The numerical value indicates the volume of nickel-prussian blue@silver nanocomposite in μl/ml (where 1, 2.5, 5 μl/ml correspond to [Ag] = 14, 35 and 70 μM, respectively).
![Figure 7. Antibacterial activity of nanocomposite.Liquid growth inhibition kinetics of (A)Escherichia coli and (B)Bacillus subtillus using different volumes of nickel-prussian blue@silver nanocomposite. The numerical value indicates the volume of nickel-prussian blue@silver nanocomposite in μl/ml (where 1, 2.5, 5 μl/ml correspond to [Ag] = 14, 35 and 70 μM, respectively).](/cms/asset/0eec9dbe-aeb2-47dc-ba4a-f1c024e16039/ifso_a_12364026_f0009.jpg)
Table 2. Zone of inhibition values of nickel-prussian blue@silver nanocomposite toward Escherichia coli and Bacillus subtillus.
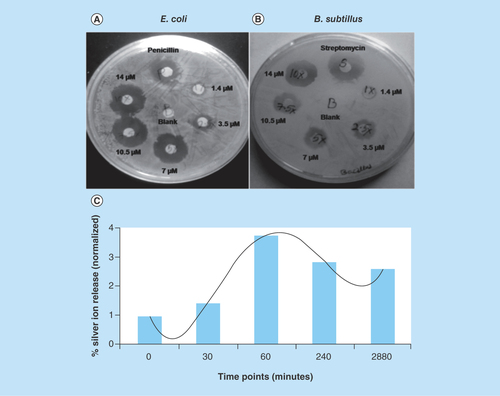
Figure 8. Zone of inhibition and silver ion release study.
Zone of inhibition of nickel-prussian blue@silver nanocomposite with different doses in (A)Escherichia coli and (B)Bacillus subtillus. Streptomycin and penicillin were kept as positive control. (C) Silver ion release kinetic study in phosphate buffer (pH 7.4) using inductively coupled plasma optical emission spectrometry analysis.