
Figures & data
Figure 1. Commonly used antitumor efficacy metrics.
Top panel: T/C ratio. Middle panel: TGI. Bottom panel: GRI. T/C overestimates the antitumor activity of the fast-growing tumors compared with the slow-growing tumors, which significantly limits its value for predicting clinical efficacy. TGI is generally less dependent on the tumor growth rate than T/C. GRI, which is calculated by fitting all available tumor volume data first to an exponential growth function, is the least dependent on the intrinsic growth rate of the tumor.
GRI: Growth rate inhibition; T/C: Tumor volume over control volume; TGI: Tumor growth inhibition.
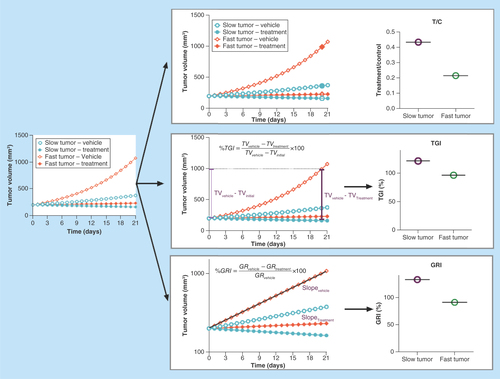
Figure 2. Correlation between tumor growth inhibition and growth rate inhibition for xenograft tumors of different growth rates.
Tumor growth inhibition and growth rate inhibition show good correlations for slow-growing xenograft tumors. For fast-growing xenograft tumors, growth rate inhibition has a much more dynamic range compared with the tumor growth inhibition, which saturates at around 100%.
GRI: Growth rate inhibition; TGI: Tumor growth inhibition.
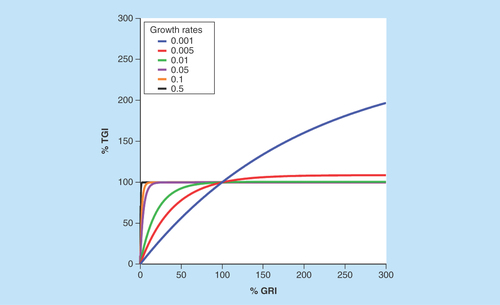
Table 1. Commonly used pharmacokinetic/pharmacodynamics models to describe tumor growth kinetics.
Figure 3. Common translational modeling approach for predicting the efficacy potential of an investigational antineoplastic agent.
Firstly, a pharmacokinetic mathematical model needs to be constructed as a foundation, based on pharmacokinetic measurements in mice. Secondly, xenograft efficacy studies are used to establish an exposure–response relationship. Thirdly, the xenograft exposure–response relationship is translated into humans based on human data. Lastly, a translational exposure-tolerability model based on animal and human toxicity data is used to predict whether the drug would have a meaningful tumor regression in humans at a tolerable dose.
PK: Pharmacokinetic.
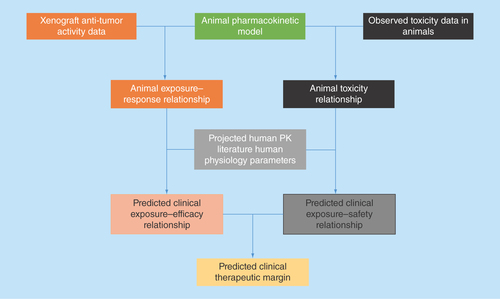
Figure 4. Antitumor activity in xenograft correlates with clinical response.
The data were collected from the literature and percentage growth rate inhibition was calculated using digitalized data [Citation12]. Antitumor activity in xenograft correlates with clinical response for a spectrum of molecularly targeted and cytotoxic agents at clinical maximum tolerable exposure.
GRI: Growth rate inhibition; RCC: Renal cell carcinoma.
![Figure 4. Antitumor activity in xenograft correlates with clinical response.The data were collected from the literature and percentage growth rate inhibition was calculated using digitalized data [Citation12]. Antitumor activity in xenograft correlates with clinical response for a spectrum of molecularly targeted and cytotoxic agents at clinical maximum tolerable exposure.GRI: Growth rate inhibition; RCC: Renal cell carcinoma.](/cms/asset/95de076f-2af4-4f10-82e8-773f2b4c16ab/ifso_a_12364098_f0004.jpg)