2,761
Views
66
CrossRef citations to date
0
Altmetric
RESEARCH PAPER

Recurrent FGFR3-TACC3 fusion gene in nasopharyngeal carcinoma

, , , , &
Pages 1613-1621 | Received 30 Apr 2014, Accepted 01 Sep 2014, Published online: 23 Dec 2014

Figures & data

Figure 1. RNA-seq to identify FGFR3-TACC3 fusion genes in NPC. Circos plot of FGFR3-TACC3 fusion genes, as detected by RNA-seq. Chromosome ideograms are shown in the outer layer. The expression level of the genes is shown in the middle layer using a heat map. The FGFR3-TACC3 fusion genes are shown in the central layer. (A) Detection of FGFR3-TACC3 fusion genes using transcriptome sequencing. The reads are aligned across the junction of the predicted fusion transcripts. (B) The genomic fusion point is between exon 19 of FGFR3 and intron 5 of TACC3. (C) Structure of the predicted fusion protein.
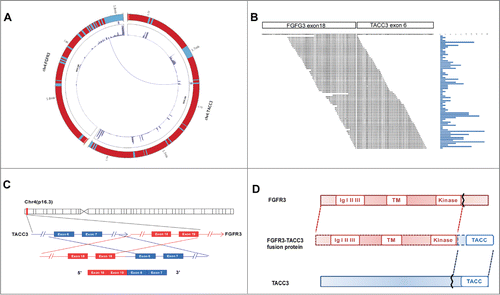
Figure 1. RNA-seq to identify FGFR3-TACC3 fusion genes in NPC. Circos plot of FGFR3-TACC3 fusion genes, as detected by RNA-seq. Chromosome ideograms are shown in the outer layer. The expression level of the genes is shown in the middle layer using a heat map. The FGFR3-TACC3 fusion genes are shown in the central layer. (A) Detection of FGFR3-TACC3 fusion genes using transcriptome sequencing. The reads are aligned across the junction of the predicted fusion transcripts. (B) The genomic fusion point is between exon 19 of FGFR3 and intron 5 of TACC3. (C) Structure of the predicted fusion protein.

Figure 2. Different forms of FGFR3-TACC3 fusion transcripts present in a variety of solid tumors. (A) Frequency and different forms of the FGFR3-TACC3 fusion gene identified in different types of cancers. (B) Identification of the fusion breakpoint using Sanger sequencing.
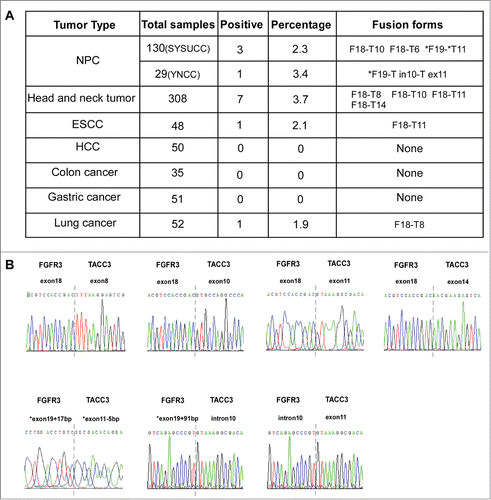
Figure 2. Different forms of FGFR3-TACC3 fusion transcripts present in a variety of solid tumors. (A) Frequency and different forms of the FGFR3-TACC3 fusion gene identified in different types of cancers. (B) Identification of the fusion breakpoint using Sanger sequencing.

Figure 3. Different forms of FGFR3-TACC3 fusion genes at the genomic DNA level. Different forms of FGFR3-TACC3 fusion transcripts at the genomic DNA level. Each rectangle indicates an exon of the FGFR3 (red) or TACC3 (blue) gene.
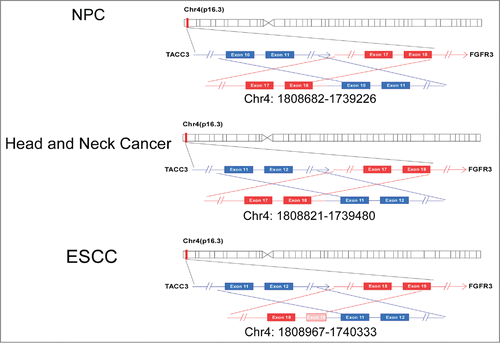
Figure 3. Different forms of FGFR3-TACC3 fusion genes at the genomic DNA level. Different forms of FGFR3-TACC3 fusion transcripts at the genomic DNA level. Each rectangle indicates an exon of the FGFR3 (red) or TACC3 (blue) gene.

Figure 4. The FGFR3-TACC3 fusion gene can promote the development of NPC. Representative pictures of the stable expression of wild-type FGFR3(F), wild-typeTACC3(T),FGFR3-TACC3(FT) fusion protein and the FGFR3-TACC3 fusion protein with the K508M mutation (FGFR3-TACC3 K508M) in HNE1 and HK1 NPC cell lines, as detected by western blotting. (A) MTT assay measuring the viability of the stable HNE1 and HK1 cell lines expressing wild-type FGFR3, wild-type TACC3, the FGFR3-TACC3 fusion protein, or FGFR3-TACC3 K508M, or the vector control. (B) MTT assay measuring the viability of the FGFR3-TACC3 fusion protein-expressing stable HNE1 and HK1 cell lines treated with 500 nM or 1000 nM PD173074. DMSO served as a negative control. The error bars denote the SEM. * refers to differences between DMSO and 500 nM PD173074 treatment, whereas # refers to differences between DMSO and 1000 nM PD173074 treatment. *** and ### mean P < 0.001 by 2-way ANOVA. (C) Cell cycle analysis of the FGFR3-TACC3 fusion protein- or vectorcontrol-expressing stable HNE1 and HK1 cell lines. * refers to differences between FT and the pBabe vector, P < 0.05 by unpaired t-test. (D) Colony formation assay of the stable HNE1 and HK1 cell lines expressing the FGFR3-TACC3 fusion protein, the FGFR3-TACC3 fusion protein with the K508M mutation (FGFR3-TACC3 K508M), or the vector control. * refers to differences between FT and the pBabe vector or FT-K, * means P < 0.05, ** means P < 0.01, *** means P < 0.001 by paired t-test. (E) Anchorage-independent growth in soft agar by the stable HNE1 cell lines expressing the FGFR3-TACC3 fusion protein, the FGFR3-TACC3 fusion protein with the K508M mutation (FGFR3-TACC3 K508M), or the vector control. 40X magnification. (F) Representative pictures of phosphorylated Akt (p-Akt), total Akt (t-Akt), phosphorylated ERK (p-ERK), total ERK (t-ERK), FGFR3 and β-actin in stable HNE1 cell lines, as determined by protein gel blotting.
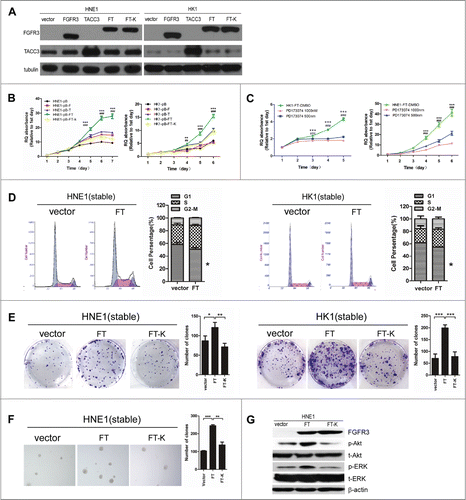
Figure 4. The FGFR3-TACC3 fusion gene can promote the development of NPC. Representative pictures of the stable expression of wild-type FGFR3(F), wild-typeTACC3(T),FGFR3-TACC3(FT) fusion protein and the FGFR3-TACC3 fusion protein with the K508M mutation (FGFR3-TACC3 K508M) in HNE1 and HK1 NPC cell lines, as detected by western blotting. (A) MTT assay measuring the viability of the stable HNE1 and HK1 cell lines expressing wild-type FGFR3, wild-type TACC3, the FGFR3-TACC3 fusion protein, or FGFR3-TACC3 K508M, or the vector control. (B) MTT assay measuring the viability of the FGFR3-TACC3 fusion protein-expressing stable HNE1 and HK1 cell lines treated with 500 nM or 1000 nM PD173074. DMSO served as a negative control. The error bars denote the SEM. * refers to differences between DMSO and 500 nM PD173074 treatment, whereas # refers to differences between DMSO and 1000 nM PD173074 treatment. *** and ### mean P < 0.001 by 2-way ANOVA. (C) Cell cycle analysis of the FGFR3-TACC3 fusion protein- or vectorcontrol-expressing stable HNE1 and HK1 cell lines. * refers to differences between FT and the pBabe vector, P < 0.05 by unpaired t-test. (D) Colony formation assay of the stable HNE1 and HK1 cell lines expressing the FGFR3-TACC3 fusion protein, the FGFR3-TACC3 fusion protein with the K508M mutation (FGFR3-TACC3 K508M), or the vector control. * refers to differences between FT and the pBabe vector or FT-K, * means P < 0.05, ** means P < 0.01, *** means P < 0.001 by paired t-test. (E) Anchorage-independent growth in soft agar by the stable HNE1 cell lines expressing the FGFR3-TACC3 fusion protein, the FGFR3-TACC3 fusion protein with the K508M mutation (FGFR3-TACC3 K508M), or the vector control. 40X magnification. (F) Representative pictures of phosphorylated Akt (p-Akt), total Akt (t-Akt), phosphorylated ERK (p-ERK), total ERK (t-ERK), FGFR3 and β-actin in stable HNE1 cell lines, as determined by protein gel blotting.

Reprints and Corporate Permissions

Please note: Selecting permissions does not provide access to the full text of the article, please see our help page How do I view content?

To request a reprint or corporate permissions for this article, please click on the relevant link below:

Academic Permissions

Please note: Selecting permissions does not provide access to the full text of the article, please see our help page How do I view content?

Obtain permissions instantly via Rightslink by clicking on the button below:

If you are unable to obtain permissions via Rightslink, please complete and submit this Permissions form. For more information, please visit our Permissions help page.