Figures & data
Figure 1. Relative levels of mRNA transcripts for the individual components of SAC. (A) Real-time q-PCR was performed to measure the relative levels of MAD1L1, MAD2L1, BUB1B, BUB3 mRNAs in the 7 GC cell lines established from primary tumor (white bars) and disseminated tumor (black bars). Each gene was normalized with GAPDH. Data are shown as relative to CCD18-Co, and the statistical significance was evaluated with ANOVA. ** P < 0.05 and *** P < 0.001. (B) Selected datasets from the Oncomine cancer microarray database were used to determine the alternations of MAD1L1, MAD2L1, BUB3 and BUB1B in mRNA expression levels. The graph represents the fold in gastric intestinal type adenocarcinoma versus normal gastric tissue based on studies reported by Cho et al., Derrico et al. and Wang et al. P < 0.001.
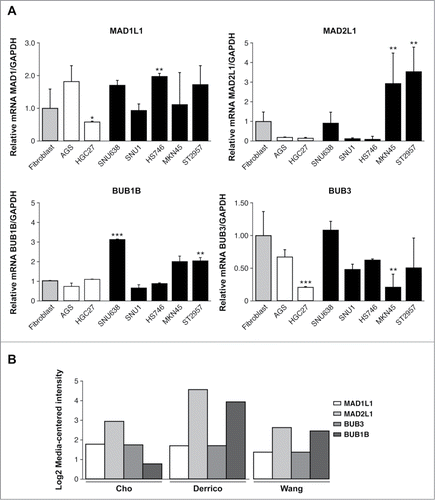
Figure 2. Mad2 and BubR1 regulate cell proliferation. (A) The MKN45 and ST2957 cell lines were transduced with lentivirus expressing sh-MAD2L1 and sh-BUB1B. The graphs show the proliferation rate measured every 24 h up to 7 d after infection, measured by crystal violet method. Data were calculated relative to the staining obtained on the first day. The experiments were done in quadruplicate at least 3 times. (B) Clonogenic assay. The graph represents the colony counting average at day 14, in 3 different areas per well. The experiment was performed in duplicate. (C) Analysis of the accumulated number of duplications over time (PDLs) in the MKN45 cell line and its transduced sh-BUB1R and sh-Mad2 cell lines. Each condition was done in duplicate.
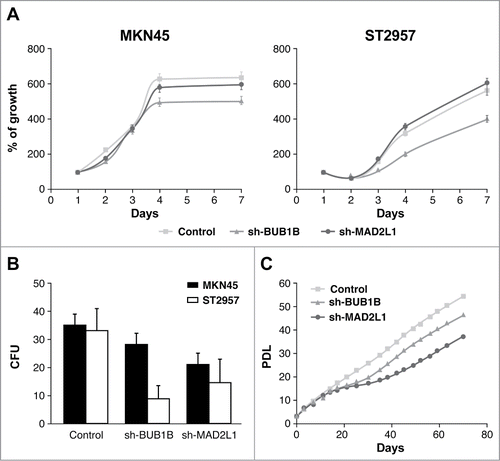
Figure 3. Silencing of Mad2 and Bub1B reduces migration and invasion in MKN45 cells. (A) Representative images of the first (0 h) and last picture (48 h) of control MKN45, sh-Mad2L1 and sh-BUB1B cells taken during the wound healing experiment. Images were taken at 10× magnification, every 2 h for 48 h. The yellow line represents the wound border. Left panel: The graph shows the percentage of wound closure over the study time using the ImageJ program. Right panel: Assessment of speed variations within the interfered cell lines and the control. The table shows the average speed for each line. The experiment was performed twice, and statistical differences were assessed by one-way ANOVA (* P < 0.05, ** P < 0.005, *** P < 0.001). (B) Transwell migration assay. The graph shows the quantification of stained migratory cells using the transwell assay without chemoattractant (basal migration control) and 30 ng/ml chemoattractant presence at 24 h. Representative photographs of stained cells attached to the bottom membrane of a transwell at the bottom. Statistical differences were assessed by a one-way ANOVA (* P < 0.05, ** P < 0.005, *** P < 0.001) (C) Transwell invasion assay. Graph shows the quantification of stained invading cells using the transwell assay with 6 μg of Matrigel, without chemoattractant (basal invading control) and 30 ng/ml chemoattractant presence at 24 h. Representative photographs of stained cells attached to the bottom membrane of a transwell at the bottom. Statistical differences were assessed by one-way ANOVA (* P < 0.05, ** P < 0.005, *** P < 0.001
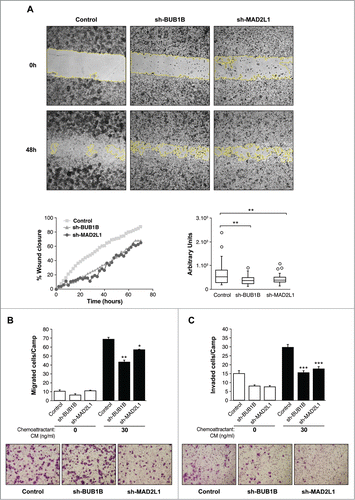
Figure 4. Interference of Mad2 and BubR1 expression increases survival to PTX in MKN45 cells. (A) Indicated cell lines were seeded on MW96 and treated with increasing doses of CDDP, PTX or BMC. Graphs show survival curves measured by MTS 48 h after treatment. The experiments were performed in quadruplicate and repeated twice. (B) Left panel: Clonogenic assay. The graph represents the average of all clones in each experimental condition, in 3 independent experiments performed in duplicate. Statistical significance was studied by a 2-way anova (* P < 0.05, ** P < 0.005, *** P < 0.001). Cells were plated at low density and treated with 0.05 μM of PTX. Right panel: Representative images of colonies from a 10-day assay in control MKN45, sh-Mad2L1 and sh-BUB1B cell lines. (C) Control MKN45, sh-MAD2L1 and sh-BUB1B cells were treated with increasing concentrations of PTX (0–100 nM). Viability was quantified using the crystal violet after 48 h of treatment. Results are presented as percentage of viable cells relative to untreated cells. Data show the results from 3 independent experiments, performed in quadruplicate. Statistical differences were tested using Student's t-test (* P < 0.05, ** P < 0.005, *** P < 0.001). (D) The effect of PTX (0.1 μM) on control MKN45, sh-Bub1B and sh-Mad2L1 cell migration in the wound healing assay was measured up to 48 h. The wound closure was quantified every 2 h postwounding by measuring the remaining unmigrated area using ImageJ.
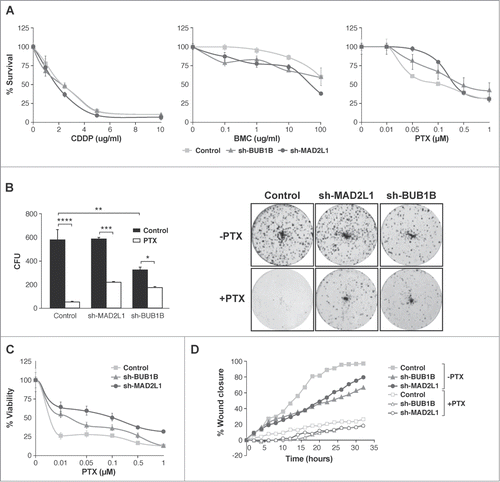
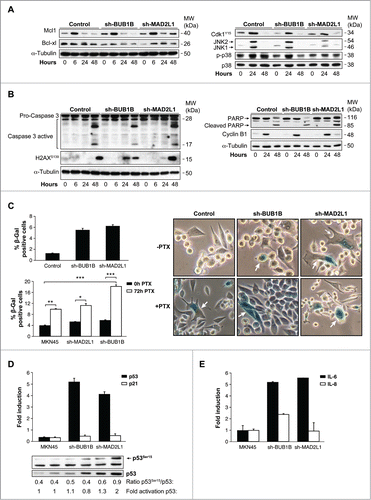
Figure 5 (See previous page). Interference of Mad2 o BubR1 expression induces senescence phenotype in MKN45. (A and B) Western blotting analysis of MKN45, sh-MAD2L1 and sh-BUB1B cultures treated with 0.1 μM PTX during several time intervals. Twenty micrograms (20 μg) of WCE protein were resolved in 15% or 8% SDS-PAGE. Expression/activation of Bcl-xl and Mcl-1 proteins (A-left panel), Cdk1Y15, JNK1/2, phosphorylated P38 and total P38 (A, right panel), Caspase-3 proteolysis, H2AX (b-left panel), PARP, cleaved-PARP, cyclin-B1 (B, right panel) were detected by using specific antibodies against each one. α-tubulin was used as a loading control. (C) Left upper panel: β-Galactosidase activity in MKN45 control and cells with Mad2 and BubR1 knockdown in 3-day cultures. Down panel: PTX effect in senescence phenotype was studied measuring β-Galactosidase activity in MKN45 control and interfered cell lines. Cells were treated with PTX (0.1 μM) for 3 d. Bars represent average of 3 independent experiments. (* P < 0.05,** P < 0.005, ***P < 0.001. Representative images of β-Galactosidase stained cell culture with and without PTX in 3 d. Arrows point to senescent cells. (D) Q-PCR analysis was performed using Taqman to measure p53 and p21 mRNAs levels in shBUB1B and sh-MAD2L1 knockdown cells referring to MKN45 cells. β-actin was used as endogenous gene control. Western blotting analysis of p53 expression in cells treated with 0.1 μM of PTX for 72 h, using a specific antibody against phosphorylated Ser15 and an antibody against the native protein. α-tubulin was used as a loading control. (E) IL-6 e IL-8 expression levels were analyzed by Q-PCR using Taqman in all cell lines in the 3-day culture. β- actin was employed as an endogenous gene control and the graph shows the fold induction referred to the MKN45 control cell line.