Figures & data
Figure 1. Structures of geranylated uridines: geranylated 2-thiouridine (ges2U), geranylated 5-methylaminomethyl-2-thiouridine (mnm5ges2U), and geranylated 5-carboxymethylaminomethyl-2-thiouridine (cmnm5ges2U).
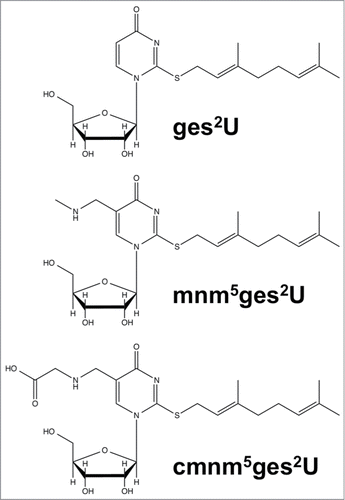
Figure 2. Structural determination of N394. (A) The CID spectra of unlabeled (top) and deuterium (D)-labeled (bottom) ct6A bases (BH2+). The product ions are assigned in the chemical structures of the ct6A base. D-labeled product ions are shown in red. Unassigned spectra containing the D-labeled portion are indicated by asterisks. (B) LC/MS coinjection of the synthetic and natural ct6A. UV traces (254 nm) and mass chromatograms (m/z 395) of synthetic ct6A (top), natural ct6A in E. coli total RNA (middle) and co-injected natural and synthetic ct6A (bottom). ct6A peaks in the UV trace are indicated by red arrows. (C) The chemical structures of ct6A and t6A are mutually convertible by hydration and dehydration. Reprinted by permission from Macmillan Publishers Ltd: Nature Chemical Biology, volume 9, pages 105–111 (2013).
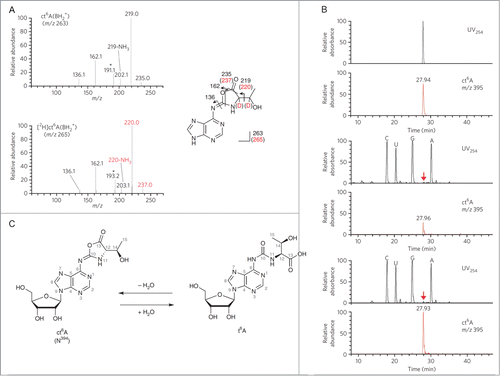
Figure 3. Hierarchical cluster analysis of toxicant-induced changes in tRNA modification spectra in wild-type yeast exposed to concentrations of MMS, H2O2, NaOCl, and NaAsO2 producing 20%, 50%, and 80% cytotoxicity. The top-left color bar indicates the range of fold change values. Figure reproduced from ref (Citation21).
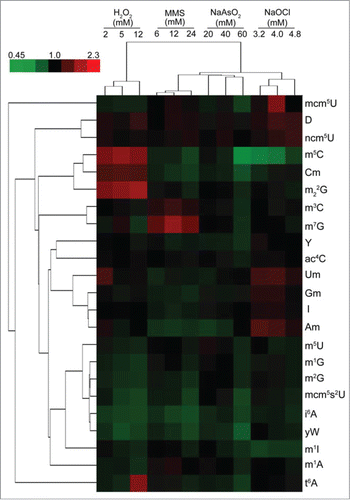
Figure 4. Information obtained by LC-MS/MS of multiplexed isotope RNA labeling, displayed for m5U as a typical ubiquitous modification. Note that the spectrum is an overlay of 3 consecutive injections. Reproduced from Ref. (Citation26) with permission from The Royal Society of Chemistry.
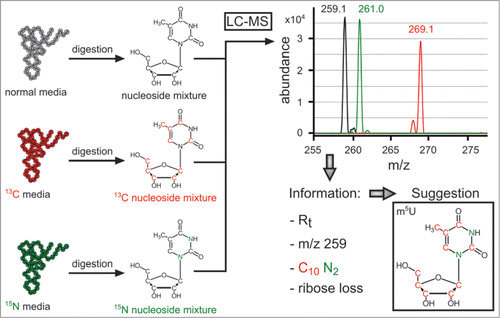
Figure 6. Schizosaccharomyces pombe Asp-tRNAGUC contains queuosine at position 34. (A) LC-MS/MS was performed on T1 digested tRNA producing a total ion chromatogram (TIC). (B) A digestion produce (m/z 1002.6) was found eluting at 39.0 min., as shown by the extracted ion chromatogram (XIC). The MS spectra at this time point depicts a signal from 3 oligonucleotides CCU[Q]UCA[m5C]Gp (m/z 1504.25−2 and 1002.58−3), AAUCCCGp (m/z 1120.33−2 and 746.67−3), and UACACAAG>p (m/z 1288.25−2 and 858.42−3). (C) Collision induced dissociation of m/z 1002.58 produces the nearly all expected –c and –y ions for the sequence CCU[Q]UCA[m5C]Gp. (D) Sequence of S. pombe Asp-tRNAGUC. Reprinted and adapted with permission from ACS Chemical Biology. Copyright 2014 American Chemical Society.
![Figure 6. Schizosaccharomyces pombe Asp-tRNAGUC contains queuosine at position 34. (A) LC-MS/MS was performed on T1 digested tRNA producing a total ion chromatogram (TIC). (B) A digestion produce (m/z 1002.6) was found eluting at 39.0 min., as shown by the extracted ion chromatogram (XIC). The MS spectra at this time point depicts a signal from 3 oligonucleotides CCU[Q]UCA[m5C]Gp (m/z 1504.25−2 and 1002.58−3), AAUCCCGp (m/z 1120.33−2 and 746.67−3), and UACACAAG>p (m/z 1288.25−2 and 858.42−3). (C) Collision induced dissociation of m/z 1002.58 produces the nearly all expected –c and –y ions for the sequence CCU[Q]UCA[m5C]Gp. (D) Sequence of S. pombe Asp-tRNAGUC. Reprinted and adapted with permission from ACS Chemical Biology. Copyright 2014 American Chemical Society.](/cms/asset/76b2f862-8c97-42e0-890f-bb923e624aec/krnb_a_992280_f0006_b.gif)
Figure 7. The standard nomenclature for oligonucleotide fragmentation during collision-induced dissociation tandem mass spectrometry (CID-MS/MS). The numbering of a-B, c and w, y fragments starts from the 5′ and 3′ terminus, respectively.
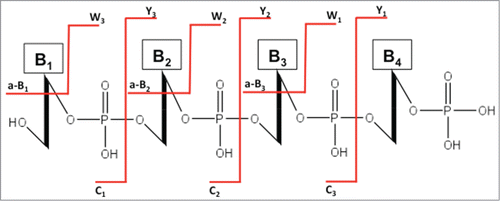
Figure 8. MALDI mass spectra obtained from the RNase T1 digestion of E. coli tRNAs. (A) m/z 900–2700; (B) m/z 2700–6000. (C) MALDI mass spectra obtained from the RNase A digestion of E. coli tRNAs. Figure reproduced from ref (Citation72).
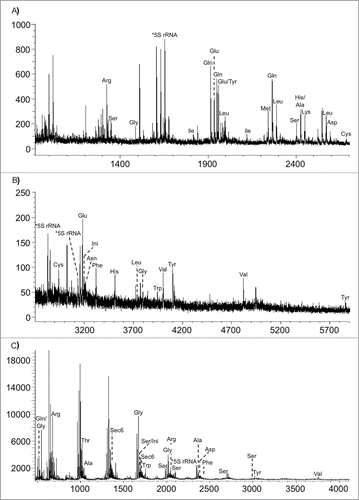
Figure 9. RNA quantification using stable isotope labeling and mass spectrometry analysis. (A) TOF MS spectra of the light and heavy oligoribonucletide AUAACCG>p observed from a range of different light:heavy ratios. (B) Light to heavy ratios obtained for 5 different oligoribonucleotides identified. (C) RNA quantification of the theoretical and experimental data from 5 different oligoribonucleotides generated from the 16S rRNA digest. The error bars represent the standard deviation. Reprinted with permission from Analytical Chemistry, volume 83, pages 4894–4901. © 2011 American Chemical Society.
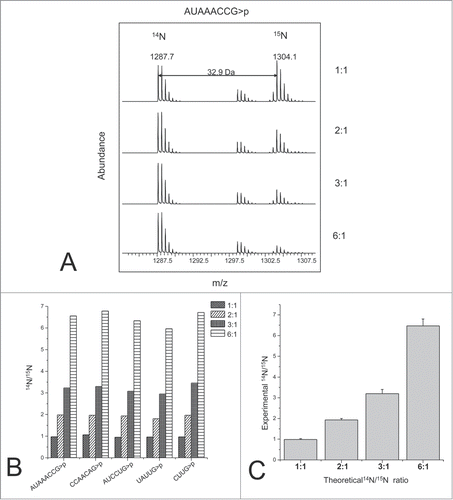
Figure 10. (See previous page). LC-MS separation and data fitting. Results of the control experiment in which 14N- and 15N-labeled and individually purified 16S RNA were mixed in a 1:1 molar ratio and digested with ribonuclease T1. (A) Low-resolution contour plot of the LC-MS run, showing pairs of the co-eluting 14N/15N rRNA fragments. Data were collected using negative ionization mode. (B) High-resolution LC-MS peak profiles (box 1), MS isotope distributions (red dots), and their least-squares fits (green traces) for a representative 16S fragment (box1 in A). (C) Ambiguity of peak identification as a function of the mass tolerance parameter (ppm). MS peaks were matched against the 16S theoretical digest (described in D), and the fraction of experimental peaks assignable to more than one rRNA fragment was calculated. Peak identification was carried out using m/z values for 14N-labeled fragments only (black); m/z for both 14N- and 15N-labeled fragments and assuming that fragments should elute within 0.1 min of each other (red); using 14N and 15N m/z and charge state (z) of the 2 species (blue). (D) Excerpt of the RNase T1 theoretical digest containing predicted 16S RNA fragments and their monoisotopic m/z values in the ‘vicinity’ of (m62A)(m62A)CCUG (gray box). Digest includes RNA species with charges 1–4, with 0−2 missed cleavages and either linear or cyclic (>p) phosphate at 3′ terminus. List is sorted by 14N m/z values. m − is a methyl group, >p − cyclic phosphate (otherwise linear), and * marks compositionally nonunique RNA fragments included as a single entry. (E) Histogram of RNA level values calculated for all 16S rRNA fragments identified in the control experiment. Reprinted with permission from Journal of the American Chemical Society, volume 136, pages 2058–2069. © 2014 American Chemical Society.
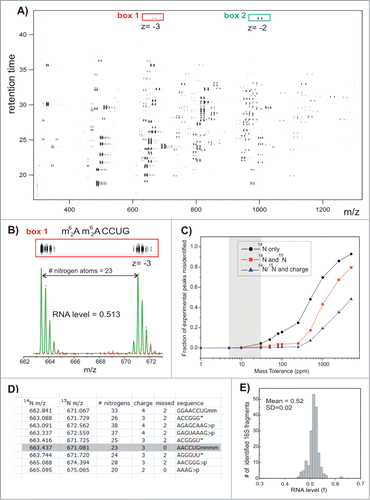
Figure 11. Improvements in singlet and doublet identification using 12C-enriched medium as illustrated with the doubly-charged E. coli total tRNA RNase T1 digestion product A[ms2i6A]AACCGp (MW 2403.4 Da). (a) Mass spectrum from sample grown in LB medium and labeled with 16O during RNase T1 digestion. (b) Same sample as in (a) except labeled with both 16O and 18O during RNase T1 digestion. (c) Mass spectrum obtained when sample grown in 12C-enriched medium and labeled with 16O during RNase T1 digestion. (d) Same sample as in (c) except labeled with both 16O and 18O during RNase T1 digestion. Singlet and doublet identifications are simplified in (c) and (d), respectively, by use of 12C-enriched medium. Figure reproduced with permission from ref (Citation121).
![Figure 11. Improvements in singlet and doublet identification using 12C-enriched medium as illustrated with the doubly-charged E. coli total tRNA RNase T1 digestion product A[ms2i6A]AACCGp (MW 2403.4 Da). (a) Mass spectrum from sample grown in LB medium and labeled with 16O during RNase T1 digestion. (b) Same sample as in (a) except labeled with both 16O and 18O during RNase T1 digestion. (c) Mass spectrum obtained when sample grown in 12C-enriched medium and labeled with 16O during RNase T1 digestion. (d) Same sample as in (c) except labeled with both 16O and 18O during RNase T1 digestion. Singlet and doublet identifications are simplified in (c) and (d), respectively, by use of 12C-enriched medium. Figure reproduced with permission from ref (Citation121).](/cms/asset/f6dc613c-75af-40f8-a6ed-53a216761300/krnb_a_992280_f0011_b.gif)
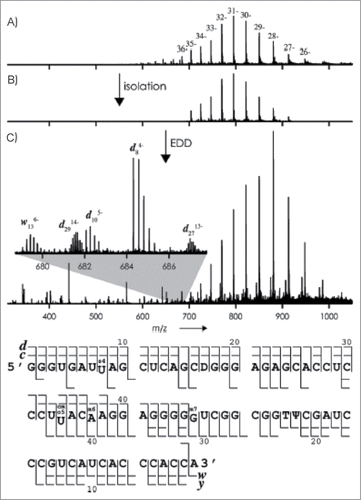
Figure 12. (A) ESI mass spectrum of tRNAVal (2 mm) in H2O/CH3OH (1:1) with piperidine (10 mm) and quinuclidine (10 mm); (B) isolation of ions with m/z values between 700 and 920; (C) mass spectrum after exposure of these ions to 28 eV electrons (the inset shows isotopically resolved fragment-ion signals). Bottom: Fragment-ion map illustrating sequence coverage from CAD and EDD of tRNAVal. Figure adapted with permission from ref (Citation86).
