Figures & data
Figure 1 (See previous page). Effects of 5-wk oral administration of cysteamine on the intestine of 2 wk-old CftrF508del mice. (A) Schematic representation of the effects of oral administration of cysteamine on the mortality of control (wild-type [WT] homozygotes or WT and F508del heterozygotes) and CftrF508del mice. (B) Cumulative survival rate in CftrF508del mice (n = 82) orally administered with either vehicle (n = 47) or cysteamine (n = 35) for 5 wk. Log-rank test, P = 0.0001. (C and D) Effects of cysteamine on CFTR and BECN1 protein levels in the intestine. (C) Mean changes of protein levels in 5 wild-type and 5 CftrF508del mice treated with either vehicle or cysteamine for 5 wk. Mean ± SD of 3 independent measurements; **P < 0.01 versus vehicle-treated CftrF508del mice (ANOVA). (D) Top, representative immunoblot with anti-CFTR (Abcam clone CF3) and BECN1 (Abcam clone Ab55878) in 1 mouse per treatment group. Bottom, densitometric measurement in the CftrF508del mouse, as percentage of vehicle-treated WT mouse normalized to TUBA levels. Mean ± SD of triplicates of independent experiments, **P < 0.01 versus vehicle-treated CftrF508del mice (ANOVA). (E and F) Effects of cysteamine on rectal potential difference (RPD) in response to 20 μM forskolin (Fsk) in 5 WT and 5 CftrF508del mice treated with vehicle or cysteamine. Measurements were conducted during continous perfusion with a Cl− free solution containing 100 μM amiloride. (E) Mean changes of RPD (ΔRPD) in response to Fsk in 5 WT and 5 surviving CftrF508del mice. Responses in CftrF508del mice were significantly smaller than in wild-type mice; responses in cysteamine-treated CftrF508del mice were significantly higher than in vehicle-treated CftrF508del mice. Mean ± SD of 5 measurements in each group; ###P < 0.001 versus vehicle-treated WT mice; ° P < 0.05 versus vehicle-treated CftrF508del mice (ANOVA). (F) Representative response to Fsk (arrow) in one WT and one surviving CftrF508del mouse per treatment group.
![Figure 1 (See previous page). Effects of 5-wk oral administration of cysteamine on the intestine of 2 wk-old CftrF508del mice. (A) Schematic representation of the effects of oral administration of cysteamine on the mortality of control (wild-type [WT] homozygotes or WT and F508del heterozygotes) and CftrF508del mice. (B) Cumulative survival rate in CftrF508del mice (n = 82) orally administered with either vehicle (n = 47) or cysteamine (n = 35) for 5 wk. Log-rank test, P = 0.0001. (C and D) Effects of cysteamine on CFTR and BECN1 protein levels in the intestine. (C) Mean changes of protein levels in 5 wild-type and 5 CftrF508del mice treated with either vehicle or cysteamine for 5 wk. Mean ± SD of 3 independent measurements; **P < 0.01 versus vehicle-treated CftrF508del mice (ANOVA). (D) Top, representative immunoblot with anti-CFTR (Abcam clone CF3) and BECN1 (Abcam clone Ab55878) in 1 mouse per treatment group. Bottom, densitometric measurement in the CftrF508del mouse, as percentage of vehicle-treated WT mouse normalized to TUBA levels. Mean ± SD of triplicates of independent experiments, **P < 0.01 versus vehicle-treated CftrF508del mice (ANOVA). (E and F) Effects of cysteamine on rectal potential difference (RPD) in response to 20 μM forskolin (Fsk) in 5 WT and 5 CftrF508del mice treated with vehicle or cysteamine. Measurements were conducted during continous perfusion with a Cl− free solution containing 100 μM amiloride. (E) Mean changes of RPD (ΔRPD) in response to Fsk in 5 WT and 5 surviving CftrF508del mice. Responses in CftrF508del mice were significantly smaller than in wild-type mice; responses in cysteamine-treated CftrF508del mice were significantly higher than in vehicle-treated CftrF508del mice. Mean ± SD of 5 measurements in each group; ###P < 0.001 versus vehicle-treated WT mice; ° P < 0.05 versus vehicle-treated CftrF508del mice (ANOVA). (F) Representative response to Fsk (arrow) in one WT and one surviving CftrF508del mouse per treatment group.](/cms/asset/5734b372-6b75-4ef4-9f8f-361cad9a0ecb/kaup_a_973737_f0001_c.jpg)
Figure 2. Effects of 5-wk oral administration of cysteamine on weight gain and lung inflammation in 2 wk-old CftrF508del mice. (A and B) Effects of cysteamine on weight gain. (A) Distribution of weight (g) variation of CftrF508del mice (n = 56) orally treated with either vehicle (n = 24) or cysteamine (n = 32) for 5 wk; °°P < 0.01 (Student t test). (B) Representative picture showing difference in body size at the end of treatment in one vehicle-treated (left) and one surviving cysteamine-treated (right) CftrF508del mice. Scale bar: 1 cm. (C) Effects of cysteamine on Tnf (left) and Cxcl2 (right) transcription levels in lung homogenates from 7-wk-old CftrF508del mice treated with either vehicle or cysteamine. Mean ± SD of triplicates of 5 surviving mice per group; °°P < 0.01 (The Student t test). (D to E) Effects of cysteamine on CFTR, and BECN1 protein levels in the lungs. (D) Mean changes of protein levels in 5 wild-type and 5 CftrF508del mice treated with either vehicle or cysteamine for 5 wk. Mean ± SD of 3 independent measurements; **P < 0.01 versus vehicle-treated CftrF508del mice (ANOVA). (E) Top, representative immunoblot with anti-CFTR (Abcam clone) and anti-BECN1 (Abcam clone Ab55878) in one mouse per treatment group. Bottom, densitometric measurement in the CftrF508del mouse, as percentage of vehicle-treated WT mouse normalized to TUBA/α-β tubulin levels. Mean ± SD of triplicates of independent experiments, **P < 0.01 versus vehicle-treated CftrF508del mice (ANOVA).
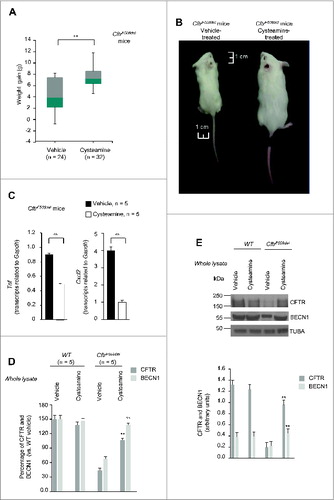
Figure 3 (See previous page). Effects of the combination treatment with cysteamine and epigallocatechin gallate (EGCG) on human airway epithelial cells and mouse lungs. (A) CFBE41o-cells were transfected with F508del-CFTR at 37 °C. After transfection, the cells were incubated for 18 h with or without cysteamine (250 μM) and then kept in medium for 24 h or 48 h in the presence or absence of EGCG (80 μM), with or without CFTRinh-172 (20 μM). Cycloheximide (CHX) (100 μg ml−1) was added during the last 8 h of incubation. The lack of CHX toxicity in this model is reported in Fig. S3A. Top, surface biotinylation followed by purification of streptavidin-bound PM proteins and immunoblot with anti-CFTR (clone CF3, Abcam). FLOT1 (clone C-2 Santa Cruz Biotechnology) confirmed cell surface protein-specific localization. Bottom, densitometric measurement of the residual CFTR at the PM expressed as fold increase of the initial amount (medium) normalized to FLOT1 levels, Mean ± SD of triplicates of independent experiments; °°P < 0.01 compared to medium (ANOVA). (B) Effects of EGCG (top) and cysteamine (bottom) on the activity of either the CSNK2A/α subunit or the CSNK2A2-CSNK2B2 (α2β2) holoenzyme acting on the synthetic peptide substrate RRRADDSDDDDD. IC50 values represent the mean of 3 independent experiments with the SD not exceeding 10%. (C) CFBE41o-cells were transfected with F508del-CFTR and incubated with cysteamine and then kept up to 48 h in medium alone as in (A). During cysteamine washout, the cells were incubated with medium or medium added with the CSNK2 inhibitor CX-4945 (5 μM) in the presence or absence of CFTRinh-172 (20 μM). CHX was added to the system as in (A). Top, surface biotinylation followed by purification of streptavidin-bound PM proteins and immunoblot with anti-CFTR (clone CF3, Abcam). FLOT1 (clone C-2 Santa Cruz Biotechnology) confirmed cell surface protein-specific localization. Bottom, densitometric measurement of the residual CFTR at the PM expressed as fold increase of the initial amount (medium) normalized to FLOT1 levels. Mean ± SD of triplicates of independent experiments, °P < 0.05, °°P < 0.01 compared to medium (ANOVA). (D) Tnf (top) and Cxcl2 (bottom) transcription levels in lung homogenates from 10-12 wk-old CftrF508del mice either immediately after treatment with vehicle or cysteamine for 7 d or alternatively after a latency of 10, 20, or 30 d without cysteamine treatment. During this “washout” period, the mice were either left untreated or treated with cysteamine. Mean ± SD of triplicates of 5 mice per group, °P < 0.05, °°°P < 0.001 compared to vehicle and **P < 0.01, ***P < 0.001 compared to 30 d of washout without cysteamine (ANOVA).
Table 1. Baseline Characteristics of the Patients
Table 2. Study design
Table 3. Treatment Effects
Figure 4. Effects of cysteamine and EGCG on surface CFTR in ex vivo cultured primary human nasal epithelial cells belonging to the enrolled F508del-CFTR homozygous CF patients. Freshly isolated brushed nasal epithelial cells were collected from 10 F508del-CFTR homozygous patients and cultured for 18 h with or without cysteamine (250 μM) and then kept for 24 or 48 h in medium or medium added with EGCG (80 μM). Brushed nasal epithelial cells from 5 non-CF healthy controls were cultured with medium alone. (A) Assessment of iodide efflux by a fluorescence assay (SPQ) upon stimulation with forskolin (Fsk) plus 3-Isobutyl-1-methylxanthine (IBMX). Rate of iodide efflux, expressed as percentage of values of 5 healthy controls. The analysis was performed on at least 50 cells per sample and per experiment. Mean ± SD of 3 experiments for each sample. °°°P < 0.001 (ANOVA). (B) Effect of incubation with CX-4549, instead of EGCG, during cysteamine washout. Assessment of iodide efflux. Mean ± SD of 3 experiments for each sample. °°P < 0.01 (ANOVA). (C and D) Effects of ex vivo treatment on CFTR protein levels at the PM of nasal epithelial cells. (C) Mean values of residual CFTR protein at the PM of patients No. 5, 6, and 10 of . The values are expressed as percentage of non-CF healthy control (considered as 100% of value). Mean values of 3 independent experiments for each sample; °°P < 0.01 compared to untreated, ##P < 0.01 compared to non-CF healthy control (ANOVA). (D) Left, representative blot of CFTR protein levels at the PM of nasal epithelial cells from one out of 5 non-CF control and one patient (No. 10 of ) out of 3 patients analyzed. Right, representative blot of CFTR protein levels at the PM of nasal epithelial cells from patient No. 10 cultured ex vivo as indicated. Top, surface biotinylation followed by purification of streptavidin-bound PM proteins and immunoblot with anti-CFTR (clone CF3, Abcam). FLOT1 confirmed cell surface protein-specific localization. Bottom, densitometric measurement of the residual CFTR at the PM expressed as percentage of non-CF healthy control (100% of value) normalized to FLOT1 levels. Mean ± SD of triplicates of independent experiments; °°P < 0.01 compared to untreated, ##P < 0.01 compared to non-CF healthy control (ANOVA).
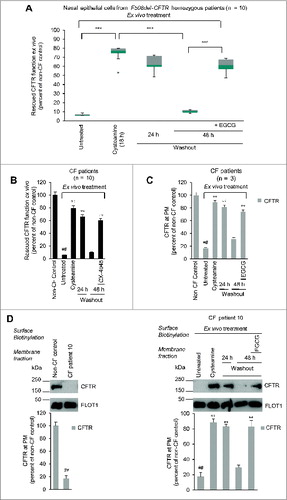
Figure 5. Effects of cysteamine and EGCG on BECN1 and SQSTM1 protein levels in ex vivo cultured primary human nasal epithelial cells belonging to the enrolled F508del-CFTR homozygous CF patients. (A and B) Effects of ex vivo treatment on BECN1 and SQSTM1 protein levels in nasal epithelial cells. (A) Mean values of BECN1 and SQSTM1 of patients No. 5, 6 and 10 of . The values are expressed as percentage of non-CF healthy control (considered as 100% of value). Mean values of 3 independent experiments for each sample; °°P < 0.01 compared to untreated, ##P < 0.01 compared to non-CF healthy control (ANOVA). (B and C) Representative blot of BECN1 and SQSTM1 protein levels in nasal epithelial cells from (B) one out of 5 non-CF control and one patient (No. 10 of ) out of 3 patients analyzed and (C) patient No. 10 cultured ex vivo, as indicated. Top, western blot analysis of insoluble and soluble protein fractions and immunoblot with anti-BECN1 (Abcam) and anti-SQSTM1 (Sigma Aldrich). ACTB was used as negative marker of the insoluble protein fraction and as loading control of the experiment. Bottom, densitometric measurement of BECN1 in the soluble fraction and SQSTM1 level in the insoluble protein fraction expressed as percentage of non-CF healthy control. Mean ± SD of triplicates of independent experiments; °°P < 0.01 compared to untreated, ##P < 0.01 compared to non-CF healthy control (ANOVA).
Figure 6 (See previous page). Effects of treatment on CFTR function and sweat chloride levels in vivo in F508del-CFTR homozygous patients. (A) Assessment of iodide efflux by a fluorescence assay (SPQ) upon stimulation with Fsk plus IBMX. Rate of iodide efflux in freshly isolated brushed nasal epithelial cells collected from all 10 F508del-CFTR homozygous patients before treatment (wk 0) and after 4, 8 and 12 wk of treatment. Values are expressed as percentage of 5 non-CF healthy controls at each time point (wk 0, 4, 8 and 12). Red markers indicate mean values. Dashed line indicates 20% of rescued function. The analysis was performed on at least 50 cells per sample and per experiment at each time point. Mean ± SD of 3 experiments for each sample, #P = 0.0003 and ##P = 0.0002 versus wk 0. (B and C) Effects of treatment on CFTR protein levels in freshly isolated nasal epithelial cells. (B) Mean values of CFTR Band C in patients No. 5, 6 and 10 of . The values are expressed as percentage of non-CF healthy control (considered as 100% of value). Mean ± SD of triplicates of independent experiments per each patient's sample; ##P < 0.01 compared to non-CF healthy control, °°P < 0.01 versus wk 0 (ANOVA). (C) Left Immunoblot detection of CFTR in whole lysates. ACTB was used as loading control. Representative blot of one non-CF control and 1 out of 3 patients with CF (No. 10 of ) analyzed before and after 8 and 12 wk of treatment in vivo. Right, densitometric measurement of CFTR expressed as ratio of Band C /B and as percentage non-CF healthy control normalized to ACTB levels. Mean ± SD of triplicates of independent experiments; ##P < 0.01 compared to non-CF healthy control, °°P < 0.01 versus wk 0 (ANOVA). (C) Assessment of iodide efflux by a fluorescence assay (SPQ) upon stimulation with Fsk plus IBMX in freshly isolated nasal epithelial cells collected from patient No 10 before treatment and after 8 and 12 wk of treatment in vivo.
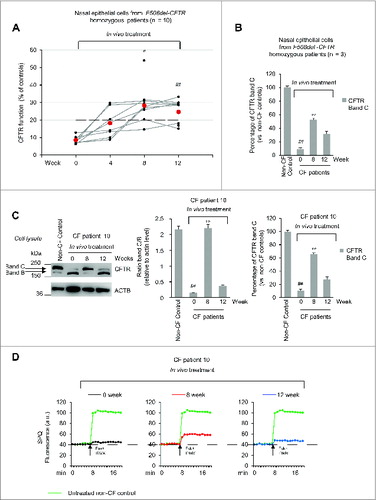
Figure 7. Effects of in vivo treatment on BECN1 and SQSTM1 protein levels in nasal brushing from F508del-CFTR homozygous patients. (A) Effects of treatment on BECN1 (left) and SQSTM1 (tight) protein levels in freshly isolated nasal epithelial cells of patients No. 5, 6 and 10 of . The values are expressed as percentage of non-CF healthy control (considered as 100% of value). Mean ± SD of triplicates of independent experiments per each patient's sample; ##p < 0.01 compared to non-CF healthy control, °P < 0.05 and °°P < 0.01 versus wk 0 (ANOVA). (B and C) Representative blot of 1 patient (No. 10 of ) out of 3 patients analyzed. (B) Western blot analysis of cell lysates and immunoblot with anti-BECN-1 (Abcam); (C) Western blot analysis of insoluble and soluble protein fractions and immunoblot with anti-SQSTM1 (Sigma Aldrich). ACTB was used as negative marker of the insoluble protein fraction and as loading control of the experiment. Bottom, densitometric measurement of (B) BECN-1 and (C) SQSTM1 levels expressed as percentage of non-CF healthy control. Mean ± SD of triplicates of independent experiments; ##P < 0.01 compared to non-CF healthy control, °P < 0.05 and °°P < 0.01 versus wk 0 (ANOVA).
Figure 8. Effects of treatment on sweat chloride levels in vivo in F508del-CFTR homozygous patients. (A) Sweat chloride levels (mmol per liter) in all the enrolled CF patients before and after 4, 8 and 12 wk of treatment and after 4 (wk 16) and 8 (wk 20) wk following drug withdrawal. Red markers indicate mean values, #P = 0.0029 vs wk 0. The dashed line indicates 60 mmol/L. (B) Inverse correlation between percent of absolute changes in sweat chloride levels and changes in rate of iodide efflux (expressed as percent of healthy controls) in nasal brushing after 8 wk of treatment in all the enrolled CF patients. The Spearman r = -0.883, P = 0.001.
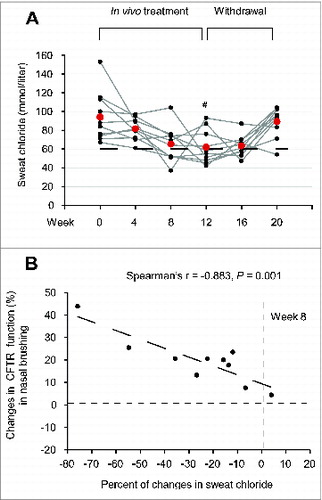
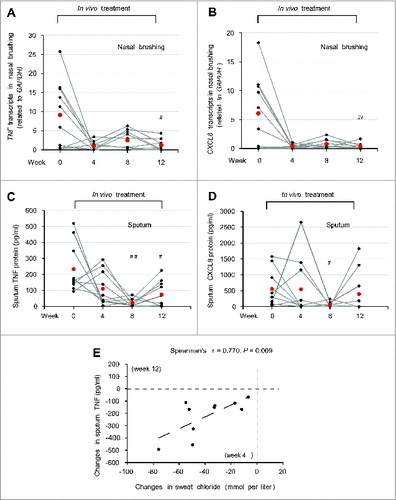
Figure 9. Effects of treatment on respiratory inflammation in vivo in F508del-CFTR homozygous patients. (A and B) TNF and CXCL8 transcript levels in nasal brushing from all the enrolled CF patients before (wk 0) and after 4, 8 and 12 wk of treatment. (A) TNF, ##P = 0.026 and (B) CXCL8, ##P = 0.023 vs wk 0. (C and D) TNF and CXCL8 protein levels (pg/ml) in the sputum before treatment (wk 0) and after 4, 8 and 12 wk of treatment. (C) TNF, ##P = 0.0019, #P = 0.016 as compared to wk 0. (D) CXCL8, #P = 0.024 vs wk 0. (E) Correlation between absolute changes in TNF protein levels (pg/ml) in the sputum after 12 wk of treatment and in sweat chloride levels (mmol/L) after 4 wk of treatment. The Spearman r = 0.770, P = 0.009.