Figures & data
Figure 1. TSPO regulates the autophagy response in FCCP-treated cells. (A) Confocal immunofluorescence microscopy shows that TSPO (green) colocalizes with VDAC1 (red) on mitochondria in MEFs. DAPI (blue) is representative of cell nuclei. (B) Western blot to demonstrate modulation of TSPO (18 kDa) in MEF cells relative to VDAC1 (32 kDa). (C) Graph shows band density analysis (n = 3; P < 0.001). (D) Real time quantitative RT-PCR analysis for estimation of Tspo mRNA levels in CF35. (E) Western blot analysis of MEFs treated with bafilomycin A1 (BAF, 100 nM), to inhibit autophagic flux, for 4 h in the presence and absence of FCCP (20 μM). (F) Graph shows LC3-II:GAPDH ratio band density analysis (n = 3; P < 0.01).
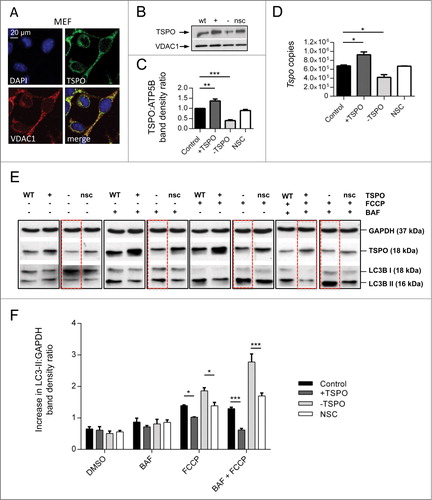
Figure 2. TSPO limits mitochondrial autophagy and SQSTM1 recruitment. (A) Representative images of TSPO-modulated CF35 cells before and after treatment with FCCP (20 μM) for 30 min. Scale bar = 50 μm. A magnification of the merged images is shown in areas demarcated by the white box. Scale bar = 5 μm. (B) Quantification of the degree of mtRFP:GFP-LC3 colocaliztion in CF35 cells (n > 10 cells; P < 0.01). (C) MEFs transfected with mtRFP (red) and treated with FCCP (20 μM) were immunolabeled against SQSTM1 (grayscale). Nuclei were stained with DAPI. White arrows show areas in both control and -TSPO cells where mitochondria have formed aggregates that colocalize with SQSTM1. (D) Quantification of SQSTM1 localization on mitochondria (n > 20 cells; P < 0.01). (E) Evaluation of the mitochondrial aggregation coefficient (determined by the ratio between the mtRFP signal intensity and the total mitochondrial area) (n > 20 cells; P < 0.001).
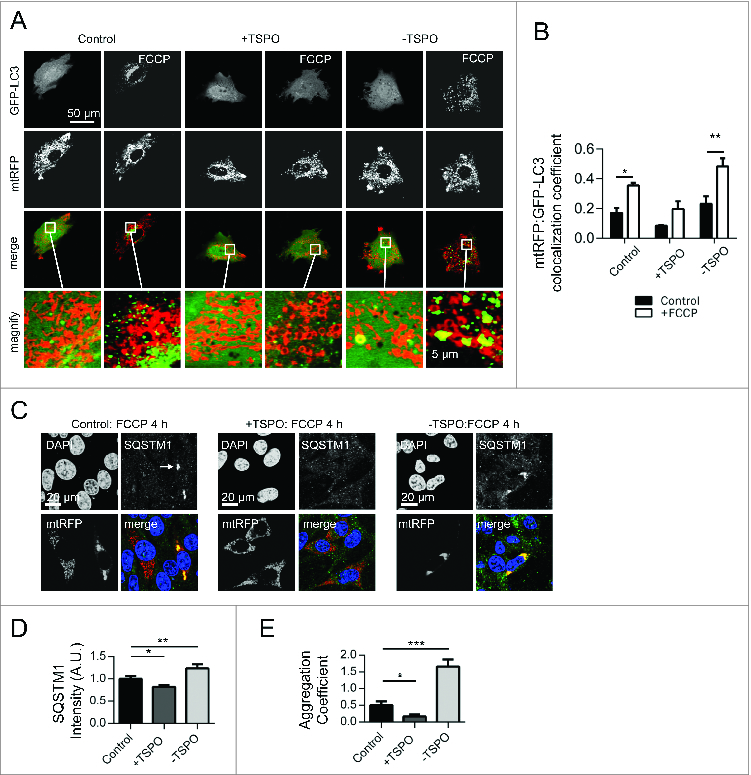
Figure 3. TSPO leaves unaltered the PINK1-PARK2 signaling pathway. (A) Confocal microscopy depicts MEFs transfected with PARK2-YFP (green) and immunolabeled against ATP5B of the mitochondrial ATPase (red). DAPI was used to stain nuclei (blue). Scale bars = 20 μm. White lines show areas selected for fluorescence intensity profiles. (B) Quantification of PARK2 translocation on mitochondria in cells treated with FCCP (n > 20 cells). (C) Representative traces of the effects of FCCP on ΔΨm in TSPO-modulated MEFs. (D) Western blot analysis of the accumulation of PINK1 long isoform (66 kDa) after FCCP treatment in TSPO-modulated MEFs with relative quantification in (E) (n = 3).
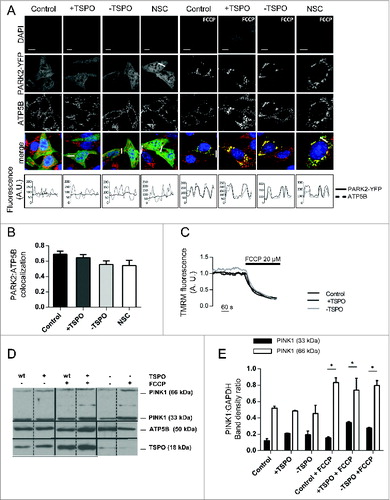
Figure 4. Mitochondrial protein ubiquitination is affected by TSPO. (A) Immunoblot of mitochondria isolated from MEFs and transfected with Tspo siRNA (-) or a nonsilencing control (nsc) to show changes in polyubiquitination before and after FCCP treatment (4 h). (B) As in (A) but with MEFs transfected with Tspo cDNA (+) or an empty vector (WT). (C) Band density analysis showing the relative increase in mitochondrial polyubiquitin following FCCP treatment (n = 3; P < 0.01). (D) Western blot to demonstrate reduced expression of TSPO in PRKCE−/− MEF cells relative to GAPDH. (E) Graph shows mean TSPO band density analysis relative to GAPDH loading control (n = 3; P < 0.001). (F) Western blot highlighting mitochondrial ubiquitination in WT and PRKCE−/− MEF cells before and after treatment with 20 μM FCCP. (G) The graph shows total ubiquitin band density analysis relative to ATP5B loading control (n = 3; P < 0.05).
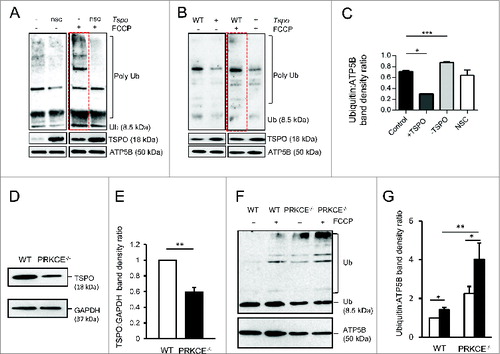
Figure 5. Antioxidants restore ubiquitination deficiency in TSPO overexpressing mitochondria. (A) Struc-tural comparison of wild type TSPO and the TSPO CRAC domain deletion mutant. TSPO transmembrane doma-ins are indicated in black. (B) Evaluation of mitochondrial cholesterol capacity following modulation of WT TSPO and insertion of the mutated isoform. (C) Control MEFs and overexpressing WT TSPO or TSPOΔ pretreated (2 h) with vehicle DMSO, MnTBAP (300 μM) or methyl-β-cyclodextrin (300 μM) were exposed to FCCP (20 μM) for 6 h. All cells were transfected with Ub-GFP and immunostained against ATP5B to distinguish mitochondria. (D) The graph shows quantification of ATP5B-Ub-GFP colocalization coefficient; (n> 10 cells; P < 0.001). (E) Representative images showing mtRFP:GFP-LC3 colocalization in MEF cells overexpressing TSPO after a 4 h expo-sure to the vehicle, DMSO or FCCP, with and without a 2-h pre-treatment with MnTBAP. (F) Confocal microscopy depicts MEFs transfected with PARK2-YFP (green) and ATP5B (red) and overexpressing either TSPO or TSPOΔ150–158 after a 2-h exposure to the vehicle DMSO or FCCP. (G) and (H) report graphs with quantification of mtRFP, GFP-LC3 and PARK2-ATP5B quantifications (n> 10 cells; P < 0.001).
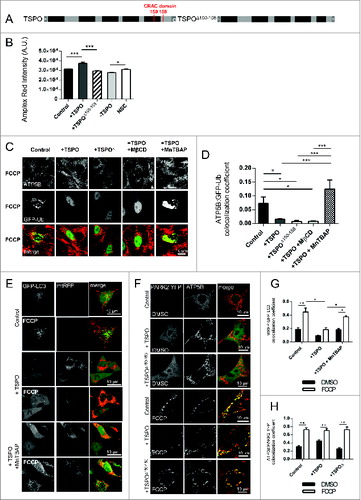
Figure 6 (See previous page). TSPO deregulates mitochondrial respiration as well as network morphology and size. (A) Reactive oxygen species generation was calculated by recording the rate of uptake of the O2− sensitive dye dihydroethidium (DHE). Left panel depicts representative traces collected in CF35 cells while (B) summarizes mean uptake rate (n > 10 cells; P < 0.001). (C) Mean traces representing accumulation of monochlorobimane-glutathione (GSH) fluorescent conjugate (n = 5 cells; P < 0.05). (D) Representative traces as recorded by a luminometer in CF35 cells transfected with mitochondria-targeted luciferase, and perfused with luciferin (20 μM) and ATP (100 μm). (E) Mean maximum luminescence is summarized (n = 3 cell populations; P < 0.05;). (F) Real-time quantitative RT-PCR analysis of mRNA expression of genes encoding mitochondrial biogenesis transcription factors in CF35 cells, Tfam (transcription factor A, mitochondrial) and Nrf1 (nuclear respiratory factor 1) (n> 4; p> 0.05). (G) Representative Z-stack maximum projection confocal images highlighting mitochondrial density in relation to the whole cell (CF35). Mitochondria are depicted by transfection with mt-GFP (green) while the whole cell is visualized by loading cells with SNARF-1 (red) for 30 min. (H) Quantification of mitochondrial volume, calculated as a proportion of the whole cell volume as analyzed by Volocity software (n > 20 cells; P < 0.01). (I) Western blot analysis of DNM1L levels in the mitochondrial and cytosolic fractions of MEFs modulated for TSPO before and after treatment with FCCP (4 h). Membranes were also probed with ATP5B and GAPDH as loading controls and TSPO to confirm TSPO modulation.
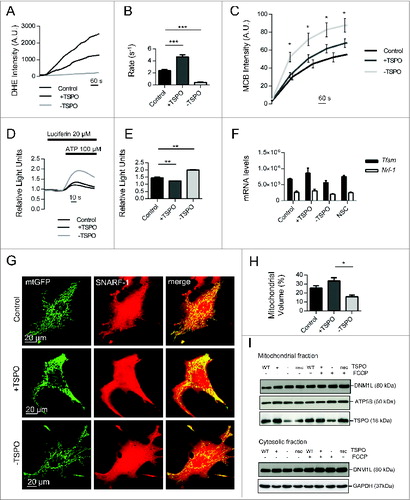
Figure 7. The mitochondrial ultrastructure is undermined by TSPO. (A) Representative electron micrographs of the perinuclear region in MEFs in control (left panel) and +TSPO conditions (right panel). (B) Graph to show numbers of mitochondria in the perinuclear region in control and +TSPO MEFs, (n = 27 cells; P < 0.001). (C) Representative electron micrographs of individual mitochondria in MEFs in control (left panel) and +TSPO conditions (right panel). (D) Graph to show the average number of cristae per mitochondrion in control and +TSPO MEFs, (n = 18 cells; P < 0.001).
Figure 8. The indispensable role of VDAC1 in the mitophagy inhibition by TSPO. (A) Cell lysates from WT MEFs were immunoprecipitated with anti-TSPO antibodies and associated VDAC1 was detected with anti-VDAC1 antibodies by western blotting; VDAC1 co-immunoprecipitates with TSPO. Five% of the lysate used for the immunoprecipitations was loaded for the input and probed with anti-VDAC1 (illustrating VDAC1 input) and anti-GAPDH (illustrating total protein input). (B) Lysates from WT MEFs expressing His-Tagged TSPO were used in affinity isolation reactions. Isolated TSPO and VDAC1 were detected with anti-TSPO and anti-VDAC1 antibodies by protein gel blotting. TSPO with the CRAC deletion is still able to interact with VDAC1. Five% of the lysate used for the affinity isolation reaction was loaded for the input and probed with anti-VDAC1 (illustrating VDAC input) and anti-GAPDH (illustrating total protein input). ROS generation was calculated by recording the rate of uptake of the O2−-sensitive dye dihydroethidium (DHE). (C) Depicts representative traces collected in MEFs while (D) summarizes mean uptake rate (P < 0.05; n > 10 cells). (E) Representative images of TSPO-modulated VDAC1−/- MEFs before and after treatment with FCCP (20 μM) for 4 h. A magnification of the merged images is shown in areas demarcated by the white box. (F) Quantification of the degree of mtRFP:GFP-LC3 colocalization in VDAC1−/− MEFs (n> 15 cells; P < 0.05).
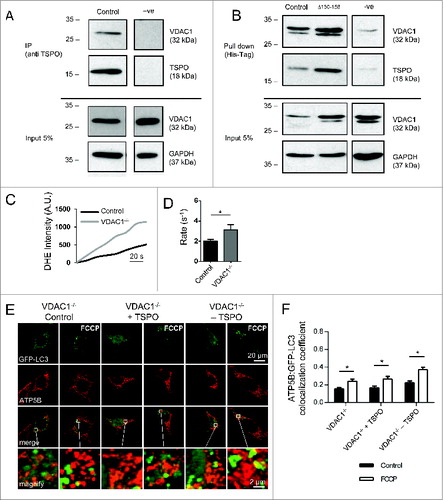
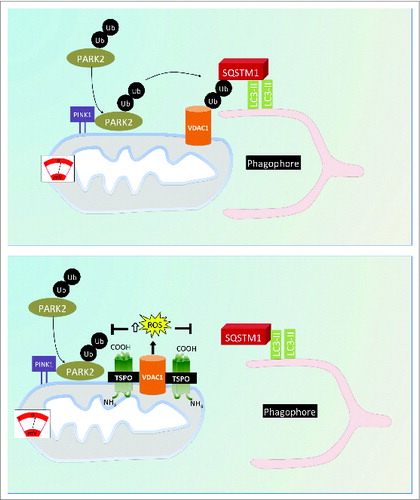
Figure 9. Proposed model for the regulation of cell mitophagy by the TSPO:VDAC1 expression ratio. Working model for the regulation of mitophagy by TSPO and VDAC1. When TSPO expression is low relative to VDAC1, ROS production is reduced, which facilitates PARK2-mediated mitochondrial ubiquitination and results in recruitment of the autophagosomal machinery. Increasing the TSPO:VDAC1 ratio leads to elevated ROS, which inhibits PARK2-mediated ubiqutination, SQSTM1 recruitment and mitophagy.