Figures & data
Figure 1. Radiosensitization of NSCLC cells. H460 (A) and A549 (B) NSCLC cells were exposed to various doses of ionizing radiation (IR) alone or in combination with 100 nM EB 1089 or 100 nM 1,25-D3 and clonogenic survival was assessed after 14 d. H460 cells (C) or A549 cells (D) both of which are wt TP53 and VDR+, were exposed to radiation (IR, 6 Gy) alone or in combination with either 100 nM EB 1089 or 1,25-D3. Viable cell number was determined at the indicated days following radiation exposure (n = 3, mean ± SE, *P < 0.05).
Figure 2. Autophagy in A549 NSCLC cells. (A) Induction of autophagy in A549 cells by radiation (IR, 6 Gy) alone or radiation+1,25-D3 by acridine orange staining. (B) Quantification of autophagy by flow cytometry in A549 cells (n = 3, mean ± SE, *P < 0.05). (C) A549 cells exposed to vehicle control, 100 nM 1,25-D3, radiation (IR, 6Gy), or 100 nM 1,25-D3 in combination with radiation. GFP-LC3 puncta indicate induction of autophagy (all images were taken at the same magnification). (D) Assessment of autophagic proteins, SQSTM1, and LC3-II in response to different treatment conditions by protein gel blots.
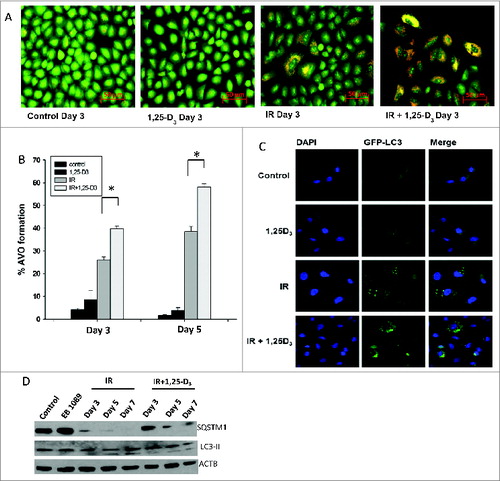
Figure 3. Autophagy in H460 NSCLC cells. (A) Induction of autophagy in H460 cells by radiation alone or the combination of radiation+ EB 1089. (B) Quantification of acidic vesicle formation in H460 cells by flow cytometry. (n = 3, mean ± SE) (C) GFP-LC3 puncta formation indicative of the induction of autophagy in H460 cells (all images were taken at same magnification). (D) Assessment of autophagic flux markers, SQSTM1 and LC3-II in response to different treatment conditions by protein gel blots. (E) Endogenous LC3-II foci formation was determined by confocal microscopy. Nuclei were stained with DAPI. Images were taken on d 3 at the same magnification.
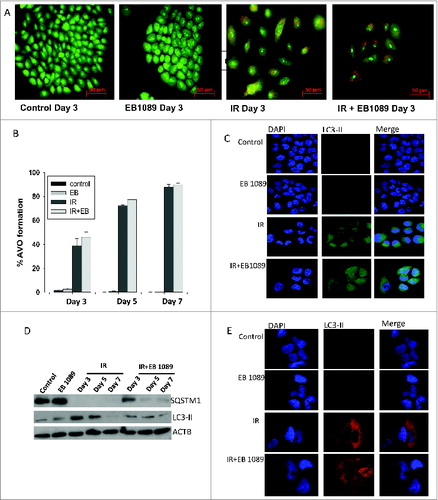
Figure 4. Evidence for cytostatic autophagy by pharmacological inhibition. (A, B) Western blot indicating that pharmacological inhibitors Baf (100 nM, panel A) and chloroquine (10 μM; panel B) inhibit autophagy by blocking degradation of SQSTM1 in lysates collected from H460 cells. (C) H460 NSCLC cells were exposed to EB 1089 (100 nM) in combination with 6 Gy radiation in the presence of chloroquine (CQ, 10 μM) or Baf ( 100 nM ) and cell viability was monitored for a period of 6 d (n = 3, mean ± SE).
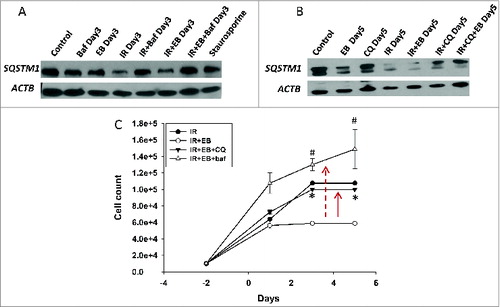
Figure 5. Cytoprotective and cytostatic autophagy (genetic silencing). (A) Silencing of ATG5 and (B) BECN1 in H460 NSCLC cells. ((C)and D) Effect of BECN1 silencing on response to radiation alone or EB 1089 + radiation was assessed by cell viability studies (n = 3, mean ± SE, *P < 0.05, #P < 0.001). ((E)and F) Effect of ATG5 silencing on response to radiation alone or EB 1089 + radiation was assessed by cell viability studies (n = 3, mean ± SE, *P < 0.05, #P < 0.001).
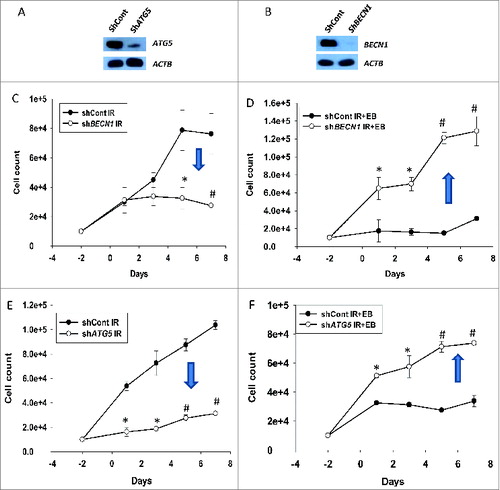
Figure 6. Cell cycle analysis. Cell cycle analysis was performed in H460 (shcont, shATG5, and shBECN1) cells. (A) Percentage of cells undergoing S-phase is shown (n = 2, mean ± SE, *P < 0.05; shcont IR+EB 1089 compared to shATG5 IR+EB 1089 and shCont IR+EB 1089 is compared to shBECN1 IR+EB 1089). (B) Percentage of cells arresting in G2/M phase is shown. n = 2, mean ± SE, *P < 0.05; shCont IR+EB 1089 compared to shATG5 IR+EB 1089, and shCont IR+EB 1089 is compared to shBECN1 IR+EB 1089.
Figure 7. Functional TP53 is required for sensitization of NSCLC cells to radiation. ((A)and B) tp53-null H1299 cells and ((C)and D) H1299 cells with TP53 induced by doxycycline (inset) were exposed to radiation (IR, 6 Gy) or EB 1089 in combination with radiation and cell viability was monitored for a period of 5 to 7 d. n = 3, mean ± SE. ( are expanded scales for IR and IR+EB 1089 *P < 0.05, #P < 0.001.).
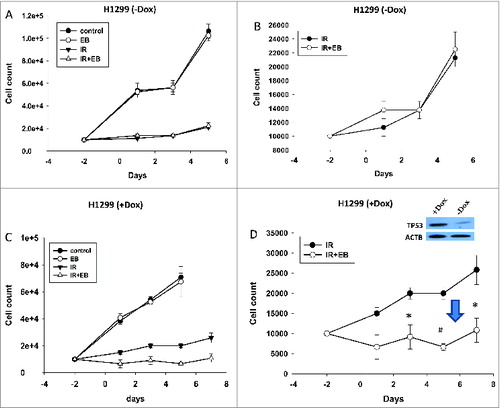
Figure 8. Blocking autophagy reverses the sensitization in TP53-inducible H1299 cells. Cell viability studies indicate that inhibition of autophagy in H1299 parental tp53-null cells by using either. (A) chloroquine or genetic silencing of (C) ATG5 or (E) BECN1 did not cause any change in sensitivity of the cells. However in TP53-inducible H1299 cells blocking autophagy either by using (B)chloroquine or genetically silencing (*P < 0.05, #P < 0.001) (D) ATG5 (*P < 0.05, #P < 0.001) or (F) BECN1 (*P < 0.05, #P < 0.001) reversed the sensitization that was achieved with the combination treatment of EB 1089 and radiation. n = 3, mean ± SE.
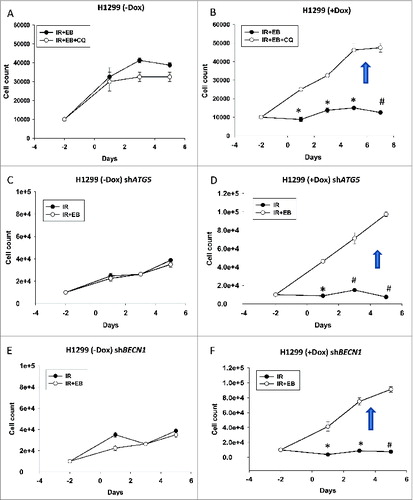
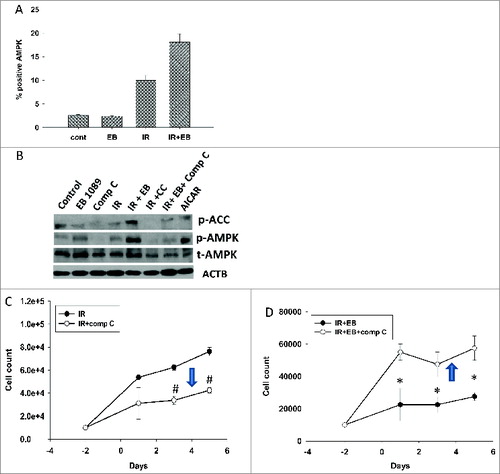
Figure 9. Dual roles of AMPK in cytoprotective and cytostatic autophagy. (A) H460 cells were exposed to 6 Gy of radiation (IR) or EB 1089 (100 nM) + radiation and phosphorylation of AMPK (Thr172) was monitored by flow cytometry at 24 h post-radiation. (B) Western blotting was performed to confirm successful inhibition of phosphorylation of AMPK and its downstream target ACC (acetyl-CoA carboxylase) by using compound C (inhibitor of AMPK). (C/D) Effect of compound C on the temporal response to radiation (IR, 6 Gy) alone (C)or EB 1089 + radiation (D) was assessed by monitoring cell viability. n = 3, mean ± SE, *P < 0.05, #P < 0.001.