Figures & data
Figure 1. Creation of gene-silenced plants. Total RNA was isolated from Control (PVX), Hsp90-(PVX:Hsp90), RAR1-(PVX:RAR1) and SGT1-(PVX:SGT1) silenced plants. Expression values of Hsp70, Hsp90, RAR1 and SGT1 were estimated by qRT-PCR, and expressed as [Qty] after normalization with actin. Values represent the means and SD from triplicate experiments. Asterisks denote values significantly different from empty PVX controls (*; P < 0.05).
![Figure 1. Creation of gene-silenced plants. Total RNA was isolated from Control (PVX), Hsp90-(PVX:Hsp90), RAR1-(PVX:RAR1) and SGT1-(PVX:SGT1) silenced plants. Expression values of Hsp70, Hsp90, RAR1 and SGT1 were estimated by qRT-PCR, and expressed as [Qty] after normalization with actin. Values represent the means and SD from triplicate experiments. Asterisks denote values significantly different from empty PVX controls (*; P < 0.05).](/cms/asset/b3aa16bc-2989-49ca-ace0-916ba385e501/kpsb_a_970410_f0001_b.gif)
Figure 2. Effect of Hsp90, RAR1 and SGT1-silencing on bacterial wilt disease by inoculation with R. solanacearum. Control (PVX), Hsp90- (PVX:Hsp90), RAR1- (PVX:RAR1) and SGT1- (PVX:SGT1) silenced plants were infiltrated with R. solanacearum. (A) Disease development of bacterial wilt was rated daily on a 0–4 disease index in control (open squares) or silenced (solid squares) plants. Asterisks denote values significantly different from those ofcontrol plants (*; P < 0.05, t-test). (B) Characteristic symptoms in control and silenced plants. Photograph was taken 12 d after inoculation with R. solanacearum.
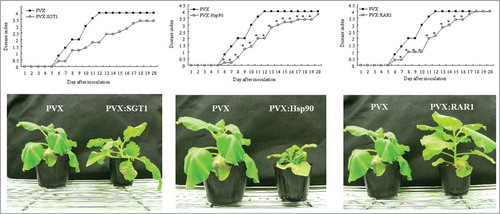
Figure 3. Growth of Ralstonia solanacearum in Hsp90, RAR1 and SGT1-silenced plants Control (PVX), Hsp90- (PVX:Hsp90), RAR1- (PVX:RAR1) and SGT1- (PVX:SGT1) silenced plants were infiltrated with R. solanacearum (108 CFU/ml). Bacterial population was determined by plating at specified time points. Values are means of 4 replicate experiments with SD. Asterisks denote values significantly different from those of empty PVX controls (*; P < 0.05, t-test).
Figure 4. Acceleration of PR genes expression in Hsp90 and SGT1-silenced plants in response to Ralstonia solanacearum infection. Total RNA was isolated from control (PVX) and Hsp90 (PVX:Hsp90) and SGT1 (PVX:SGT1)-silenced plants inoculated with R. solanacearum (108 CFU/ml). Relative expression of PR-1a and PR-4 transcripts were normalized with actin and calculated as relative to the non-treated control. Values represent the means and SD from triplicate experiments. Asterisks denote valuessignificantly different from empty PVX controls (*; P < 0.05).