801
Views
2
CrossRef citations to date
0
Altmetric
Short Communication

Sunflower exposed to high-intensity microwave-frequency electromagnetic field: electrophysiological response requires a mechanical injury to initiate

, , &
Article: e972787 | Received 27 May 2014, Accepted 17 Jul 2014, Published online: 05 Feb 2015

Figures & data

Figure 1. Experimental set-up for real-time monitoring of plant temperature and EPV in response to EMF. Top view of the general arrangement (A): Plants (1) were illuminated inside a wide (72 m3) anechoic chamber (2). The EMF was generated by a signal generator (3) connected to an amplifier (4) and emitted by a horn-antenna (5). The EMF was monitored by a field probe (6). Temperature of the plant was monitored by a thermal video camera (7) itself tracked by a security camera (8). The electrical potential monitoring system was shielded inside a small faraday box (9). Output signals from the electrophysiological amplifiers were transmitted to a data acquisition cartridge (10) through BNC shielded cables. An external computer allowed all signals control and monitoring (11). Detailed profile view of the shielded set-up (B): only the upper part (≈ 30 cm) of the plant stem (with leaves) was EMF exposed. The distance plant-antenna was ≈ 50 cm. The small arrow on the plant stem symbolizes the EMF focalizing point (f). The plant was immobilized inside the small Faraday box through a tubular metallic wave-guide (1) by a polystyrene holder. The rest of the plant, the 2 very high impedance amplifiers (2), the extra-thin tungsten measuring electrodes (3) and the reference cells (4) were all protected from the EMF inside the shielding box (5). The 2 measuring electrodes were hand inserted perpendicularly to each other in the plant stem and spaced by 5 to 7 cm. The references cells and the Faraday box were connected to the ground.
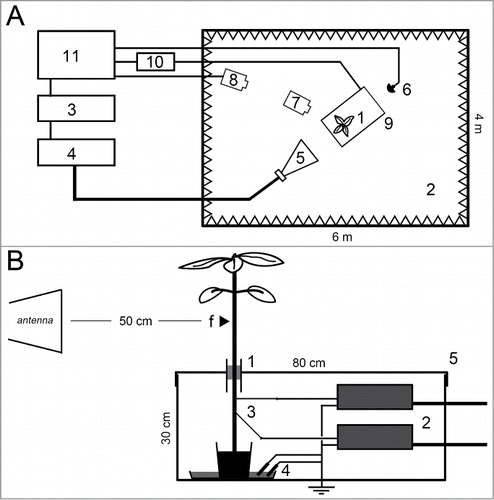
Figure 1. Experimental set-up for real-time monitoring of plant temperature and EPV in response to EMF. Top view of the general arrangement (A): Plants (1) were illuminated inside a wide (72 m3) anechoic chamber (2). The EMF was generated by a signal generator (3) connected to an amplifier (4) and emitted by a horn-antenna (5). The EMF was monitored by a field probe (6). Temperature of the plant was monitored by a thermal video camera (7) itself tracked by a security camera (8). The electrical potential monitoring system was shielded inside a small faraday box (9). Output signals from the electrophysiological amplifiers were transmitted to a data acquisition cartridge (10) through BNC shielded cables. An external computer allowed all signals control and monitoring (11). Detailed profile view of the shielded set-up (B): only the upper part (≈ 30 cm) of the plant stem (with leaves) was EMF exposed. The distance plant-antenna was ≈ 50 cm. The small arrow on the plant stem symbolizes the EMF focalizing point (f). The plant was immobilized inside the small Faraday box through a tubular metallic wave-guide (1) by a polystyrene holder. The rest of the plant, the 2 very high impedance amplifiers (2), the extra-thin tungsten measuring electrodes (3) and the reference cells (4) were all protected from the EMF inside the shielding box (5). The 2 measuring electrodes were hand inserted perpendicularly to each other in the plant stem and spaced by 5 to 7 cm. The references cells and the Faraday box were connected to the ground.

Figure 2. Experimental validation of the electrophysiological set-up. The graphs show the monitoring of EPV with 2 tungsten electrodes (up: black-line; down: gray-line) inserted as described in . Data are baseline-adjusted and expressed in millivolt (the plants resting electrical potentials were 200 to 350 mV). Sunflower leaf flaming (A): one upper leaf of a 4-weeks-old plant was flamed for 1 sec at time 0 min. Shading (B): a sunflower plant was exposed to a light-to-dark switch (200 to 0 μmol/m2/s) at time 0 min.
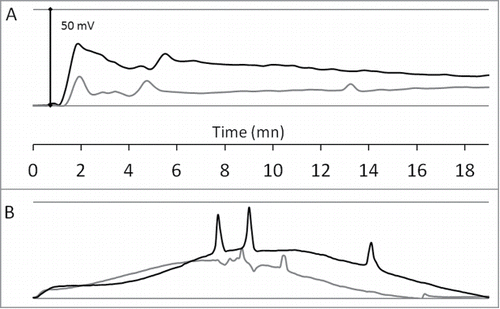
Figure 2. Experimental validation of the electrophysiological set-up. The graphs show the monitoring of EPV with 2 tungsten electrodes (up: black-line; down: gray-line) inserted as described in Figure 1B. Data are baseline-adjusted and expressed in millivolt (the plants resting electrical potentials were 200 to 350 mV). Sunflower leaf flaming (A): one upper leaf of a 4-weeks-old plant was flamed for 1 sec at time 0 min. Shading (B): a sunflower plant was exposed to a light-to-dark switch (200 to 0 μmol/m2/s) at time 0 min.

Table 1. Bending time points and temperature thresholds

Figure 3. Sunflower exposition to high-intensity microwave-frequency EMF. Height sunflower plants were exposed to a 2.5 GHz ‑ 1.5 kV/m EMF (dashed timeline). The graphs show the monitoring of EPV with 2 tungsten electrodes (up: black-line; down: gray-line) inserted as described in . Data are baseline-adjusted and expressed in millivolt (the plants resting electrical potentials were 200 to 350 mV). Black bars symbolize the time point of stem or petiole bending. Free apex (A): Four sunflower plants were exposed to EMF as described in . Tied apex (B): To avoid stem bending, the sunflower plants apexes were tied with a non conductive plastic string, before exposure to EMF.
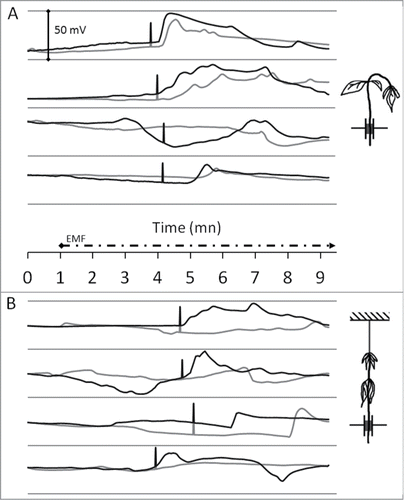
Figure 3. Sunflower exposition to high-intensity microwave-frequency EMF. Height sunflower plants were exposed to a 2.5 GHz ‑ 1.5 kV/m EMF (dashed timeline). The graphs show the monitoring of EPV with 2 tungsten electrodes (up: black-line; down: gray-line) inserted as described in Figure 1B. Data are baseline-adjusted and expressed in millivolt (the plants resting electrical potentials were 200 to 350 mV). Black bars symbolize the time point of stem or petiole bending. Free apex (A): Four sunflower plants were exposed to EMF as described in Figure 1. Tied apex (B): To avoid stem bending, the sunflower plants apexes were tied with a non conductive plastic string, before exposure to EMF.

Figure 4. Effect of the radiated energy decrease on the plant response delay. Sunflower plants were exposed to a 2.5 GHz ‑ 1.5 kV/m EMF showing various duty cycles (50 to 5 %). As illustrated on the x-axis, the duty cycle is the percentage of emission during one period. Black squares display the time point of stem bending (followed by EPV).
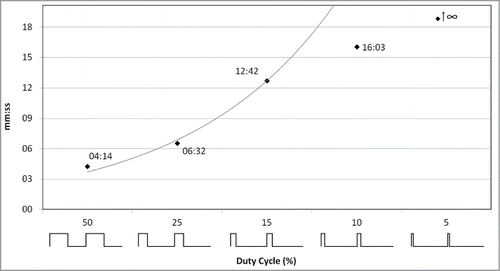
Figure 4. Effect of the radiated energy decrease on the plant response delay. Sunflower plants were exposed to a 2.5 GHz ‑ 1.5 kV/m EMF showing various duty cycles (50 to 5 %). As illustrated on the x-axis, the duty cycle is the percentage of emission during one period. Black squares display the time point of stem bending (followed by EPV).

Reprints and Corporate Permissions

Please note: Selecting permissions does not provide access to the full text of the article, please see our help page How do I view content?

To request a reprint or corporate permissions for this article, please click on the relevant link below:

Academic Permissions

Please note: Selecting permissions does not provide access to the full text of the article, please see our help page How do I view content?

Obtain permissions instantly via Rightslink by clicking on the button below:

If you are unable to obtain permissions via Rightslink, please complete and submit this Permissions form. For more information, please visit our Permissions help page.