
Figures & data
Figure 1. Selection scheme. After antibody selection by phage display, the selection outputs are transferred to a yeast display vector where additional fluorescence activated cell sorting is carried out. Antibodies are then recloned for secretion and tested for specificity.
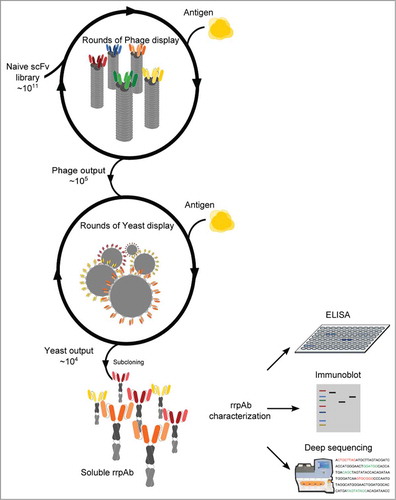
Figure 2. Characterizing the system and establishing optimal selection conditions. (a) Flow cytometry plot, in which each dot represents an individual yeast clone displaying antibodies. The number of positive antibody clones is represented by those found in the top-right quadrant that both express scFv and bind target. Only after 2 rounds of phage selection are there enough positive clones to sort effectively. The binding population increases significantly after one or 2 rounds of fluorescence activated cell sorting. (b) ELISA testing of normalized amounts of soluble polyclonal antibodies obtained after one or 2 rounds of sorting. Two monoclonal scFvs in the minibody format (anti-lysozyme and anti-ubiquitin) were used as controls. (c) Plot of antibody affinity versus abundance ranking position for the antibodies described in Table 2 after one (gray dots) or 2 (black dots) sorts. With the exception of the 2 clones indicated by gray circles, antibodies were common to both selections (dashed connectors). (d) Phylogram of anti-ubiquitin HCDR3 identified in 2+2 through deep sequencing. Ranking position (HCDR3.x) and abundance within the polyclonal population (%) are shown. The 10 most abundant HCDR3 clones are shown in blue. The x-axis shows evolutionary distance as substitutions per site; scale bar depicts 3 amino acid changes.
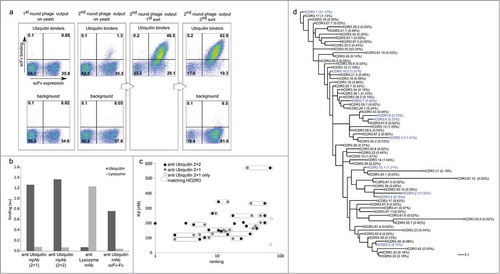
Table 1. Deep sequencing characterization of selected anti-ubiquitin scFvs shows the number of unique HCDR3 binned at a Hamming distance of 1 is 98 after one, and 67, after 2 rounds of sorting, with 58 common to both
Table 2. Random clones from the selection output tested for binding affinity. The different HCDR3s were identified through Sanger sequencing of the full length scFv. The ranking refers to the position of the specific HCDR3 in the deep sequencing characterization of the polyclonal output after one or 2 sorts
Figure 3. Polyclonal amplification and renewability. (a) Percentage clone abundance of the commonest 20 clones assessed by deep sequencing, after cloning from display to secretion vector and after 4 one hundred-fold amplifications (b–c): Maintenance of antibody functionality after each one hundred-fold amplification in ELISA (b) and Western blotting (c).
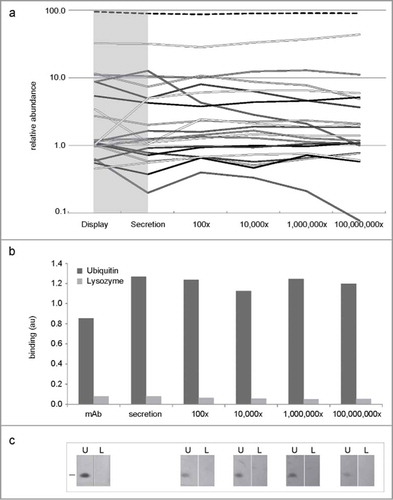
Figure 4. Polyclonal antibody functionality. (a) All yeast displayed polyclonal antibodies are specific when tested against all other antigens, as represented by the dot plots on the diagonal, all of which are highly positive (blue dots), with the exception of antibodies against CTBP1 and CTBP2 which show some cross-reactivity. (b) Although CTBP1 and CTBP2 are 78% homologous, specific polyclonals recognizing each can be selected by carrying out negative selections. The desired and unwanted specificities are highlighted in the yellow and red quadrants, respectively. (c–d) After subcloning for secretion, all polyclonals are highly specific for their target antigens in ELISA (c) and Western (d). In the Western blot assay, each rrpAb was tested on its specific antigen (left lane) and on the mix of all the other 7 test antigens (controls lane).
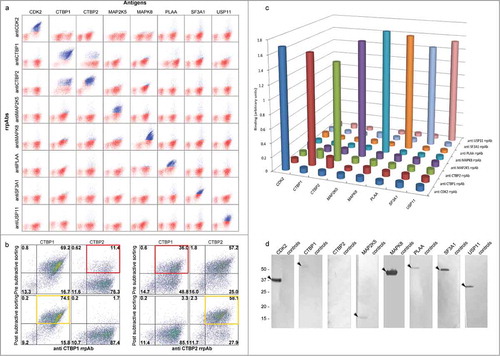
Figure 5. Anti-CDK2 polyclonal validation. (a) rrpAb WB on cell lysates. The anti-CDK2 rrpAbs is functional in WB recognizing the target CDK2 as purified recombinant protein (lane CDK2) or on HEK293 lysate, recognizing both bands of the correct size (difference in size between the 2 recognized proteins is attributed to the expression tags in the recombinant format). (b) Comparison of the commercial anti-CDK2 polyclonal antibody (sc-163) with the anti-CDK2 rrpAb in an array assay. The polyclonal antibodies are challenged against 79 different proteins (detected with streptavidin- top panel). Binding specificity of the commercial (central panel) and of the rrpAb (lower panel) anti-CDK2 is reported in the bottom chart. White squares indicate the IgG calibrator used for normalization. Yellow and red squares indicate the specific and non-specific antigen binding, respectively.
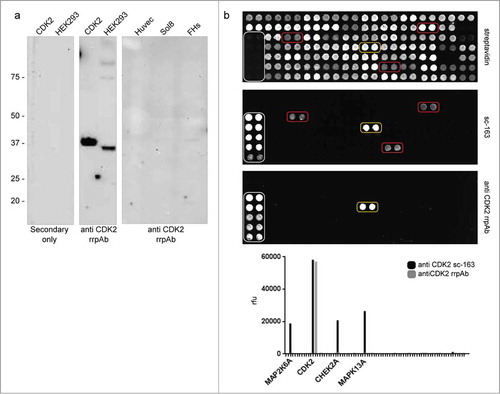
Table 3. Deep sequencing characterization of selected scFv against 6 different targets. Total number of Ion Torrent sequences, number of unique HCDR3 and percentage of the top 1 and the top 10 most abundant clones in each selection output are reported. Symbols indicate identity of HCDR3 clones in the different selection outputs. The characterization of the anti-CTBP2 rrpAb is shown, before and after negative sorting with the highly homologous CTBP1 protein