Figures & data
Figure 1. The C. difficile TcdA and TcdB cellular intoxication process. (A) The domain structure of TcdB. The N-terminal catalytic domain is shown in red, the cysteine protease domain in blue, the central hydrophobic domain is shown in yellow, with the pore forming region (PFR) highlighted, finally the C-terminal receptor binding domain is colored green. The amino acid residue number defining the boundary of each domain is also indicated. (B) The cellular intoxication process mediated by TcdA and TcdB of C. difficile. The initial steps involve binding of TcdA (ToxA) or TcdB (ToxB) to unknown cellular receptors followed by endocytosis of the toxins into a cellular endosome. Acidification of the endosome then results in the insertion of the toxin into the endosomal membrane and the formation of a pore which, following an inositol hexakisphosphate (InsP6) dependent and cysteine protease domain mediated autocatalytic cleavage event, facilitates the release of the active glucosyltransferase domain into the cytosol. This results in glucosylation and inactivation of Rho family GTPases and the onset of pathogenic effects. © 2011 Nature Publishing Group. Reproduced by permission of Nature Publishing Group. Permission to reuse must be obtained from the rightsholder.Citation22
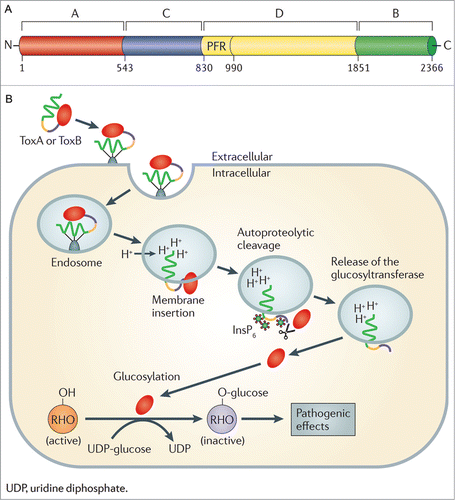
Figure 2. CDT-induced disruption of the actin cytoskeleton of Caco-2 cells and the development of cellular protrusions comprised of microtubules. CDT-induced disruption of cells and development of microtubules using 20 ng/ml CDTa and 40 ng/ml CDTb are shown to increase over time (1 hr–2 hrs). TRITC-conjugated phalloidin (red) was used to stain for actin; α-tubulin (using indirect immunofluorescence) is shown in green and cell nuclei (blue) were stained using DAPI. Dotted line delineates the cell border; a magnified view of the protrusions and cytoskeletal disruption is shown in the lower, middle panel. Scale bar denotes 20 μm. © Copyright Clearance Centre. Reproduced by permission of American Society of Microbiology. Permission to reuse must be obtained from the rightsholder. Citation54
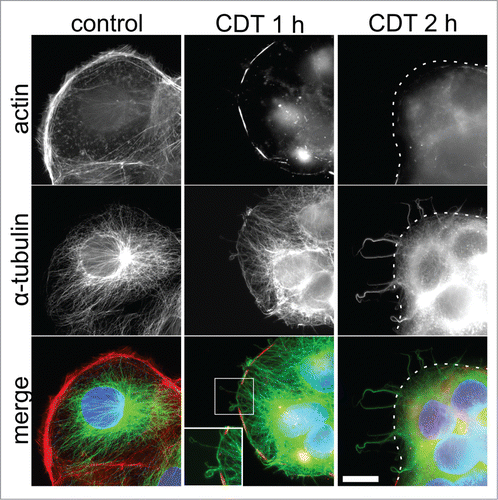
Figure 3. C. difficile spores imaged by electron microscopy. (A) Transmission electron micrograph of sectioned C. difficile 630 spore, demonstrating the ultrastructure including the exosporium, coat, cortex, core, membrane and ribosomes. Bar, 100 nm. (B) Transmission electron micrograph of thin sections of a C. difficile R20291 spore, showing the spore coat and exosporium. Bar, 200 nm. (C): Scanning electron micrograph of C. difficile 630 spores adhered to 5 day old cultured Caco-2 cells. Arrows indicate interaction with the microvilli of the Caco-2 cells. Bar, 1000 nm. Reproduced from Lawley et al. (2009) (A) ©2009 American Society for Microbiology. Reproduced by permission of American Society for Microbiology. Permission to reuse must be obtained from the rightsholder.83; Reproduced from Barra-Carrasco et al. (2013) (B)Citation ©2013 American Society for Microbiology. Reproduced by permission of American Society for Microbiology. Permission to reuse must be obtained from the rightsholder.86; (C) © 2012 Society for General Microbiology. Reproduced by permission of Society for General Microbiology. Permission to reuse must be obtained from the rightsholder.Citation92
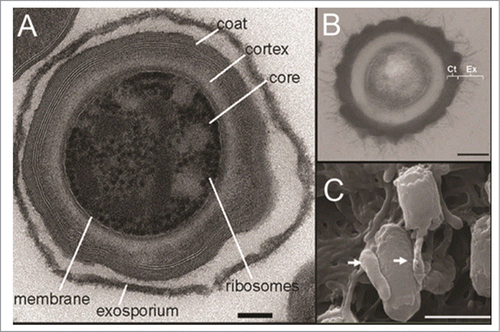
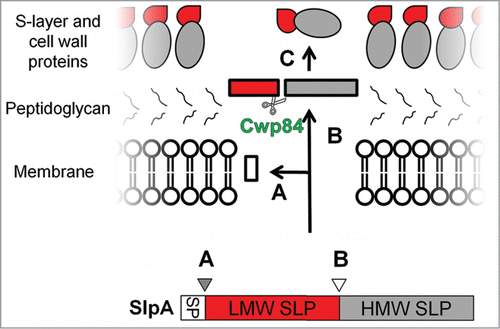
Figure 4. The S-Layer protein complex of C. difficile. The S-layer of C. difficile is composed of high and low molecular weight surface layer proteins (HMW and LMW SLPs). Figure shows the steps involved in the maturation of the S-layer protein complex. Three-stages are shown: (A) - the removal of the signal peptide, (B) - cleavage of SLP by the protease, Cwp84, to generate HMW and LMW, and (C) - The formation of the S-layer matrix by the re-association of the LMW and HMW SLPs. Reprinted with permission from Dang TH, de la Riva L, Fagan RP, Storck EM, Heal WP, Janoir C, Fairweather NF, Tate EW. Chemical probes of surface layer biogenesis in Clostridium difficile. ACS Chem Biol 2010; 5:279-85; PMID:20067320; http://dx.doi.org/10.1021/cb9002859. Copyright 2010 American Chemical Society.Citation116