Figures & data
Figure 1. Immunohistochemistry staining of MECA-79+ and CD31+ vessels, CD3+, CD20+ cells in paraffin-embedded formalin fixed samples of healthy colon and colorectal tumor. (A) Detail of a HEV in gray (MECA-79+). Consecutive sections stained with (B) MECA-79 (gray), CD3 (brown), CD20 (pink) and (C) CD-31. (D) Representative example of a healthy colon lacking lymphoid A/F. The section was stained with anti-CD3, CD20 and MECA-79. (E) Overview of a colorectal adenocarcinoma. The area highlighted in green illustrates the extra-tumoral area, surrounding the tumor but not the tumor itself. HEVs were located in the extra-tumoral area at the advancing tumor invasive margin. (F) Lymphoid aggregates were located ahead of the tumor edge/tumor invasive margin. The area between the black line and the dashed line indicates where T cells were enumerated. The distance between these two lines is equivalent to one high power field at 600x magnification. (G) Detail of a lymphoid aggregate/follicle with a HEV within the tumor center. HEV, high endothelial venule. A/F, lymphoid aggregates/ follicles.
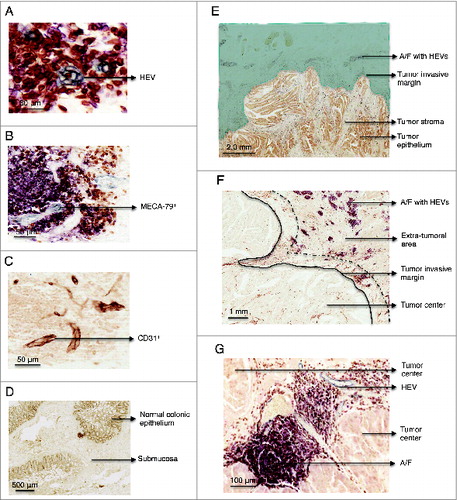
Figure 2. Relationship between lymphoid aggregates, high endothelial venules and T cell infiltration at the invasive margin and the tumor center. (A) Lymphoid aggregate without HEVs. (B) Lymphoid aggregate with HEVs. (C) Lymphoid follicle without HEVs. (D) Lymphoid follicle with HEVs. (E) Lymphoid A/F density vs. HEV density in the extra-tumoral area of all tumors (n = 62). (F) Lymphoid A/F density vs. HEV density in the tumor center. (G) HEV density in the extra-tumoral area vs. CD3 counts at the tumor invasive margin (black) and in the tumor center (gray) (n = 62). HEV, high endothelial venule. A/F, lymphoid aggregate/ follicle. HPFV, high power field of view. The white dashed lines in (C) and (D) represents organized B cell areas in follicles. p < 0.05 was considered significant.

Figure 3. Lymphoid aggregate/follicle density is a marker of disease progression but not survival. (A) HEV density in the extra-tumoral area in Dukes’ A and C cases. (B) Density of lymphoid aggregates/follicles in the extra-tumoral area in Dukes’ A and C cases. (C) CD3 counts per 10 HPFV at the tumor invasive margin vs. HEV density in the extra-tumoral area for Dukes’ A (black) and C (gray). (D) The median density in the extra-tumoral area was used to categorize cases into HEV low and HEV high. T cell ratios at the advancing margin of HEV low and high tumors in: (E) patients who survived 5 yeras post-colectomy and (F) patients that survived less than 5 yeras post-surgery. Conventional T cells (Tcon) were considered to be CD4+ and CD8+ T cells combined excluding FoxP3+ T cells. (G) Lymphoid aggregate/follicle density in the extra-tumoral area for Dukes’ C patients who survived for more or less than 5 yeras post-colectomy. The median value with the interquartile range is shown for (A), (B), (E), (F) and (G). HEV, high endothelial venule, A/F, lymphoid aggregates/follicles. Hpfv, high power field of view. p < 0.05 was considered significant.