2,620
Views
86
CrossRef citations to date
0
Altmetric
Original Research

Sunitinib depletes myeloid-derived suppressor cells and synergizes with a cancer vaccine to enhance antigen-specific immune responses and tumor eradication

, , , &
Article: e989764 | Received 08 Oct 2014, Accepted 14 Nov 2014, Published online: 02 Apr 2015

Figures & data

Figure 1. The effect of sunitinib treatment on intratumoral MDSC, Tregs, CD8+ T cells and activation status of the CD8 T cell population. C57Bl6 mice were subcutaneously inoculated with TC-1 tumor cells (n = 3–6 mice/group). On day 15 after tumor inoculation, sunitinib treatment was started, daily, i.p., for a period of 9 consecutive days. Three increasing dosages of sunitinib were used: 20, 40 and 60 mg/kg body weight. Mice were sacrificed and tumors and spleens were harvested. The levels of (A) MDSCs (CD11b+Gr1+), (B) Tregs (CD4+FoxP3+), (C) CD8+ T cells (CD8+; black bars) and the activation status of CD8+ T cells (CD69+; white bars) were analyzed by immunostaining and multicolor fluorescence cytometry. Experiments were repeated twice. Shown here are averages and SD for each experimental group (*p < 0.05; **p < 0.01; ***p < 0.001).
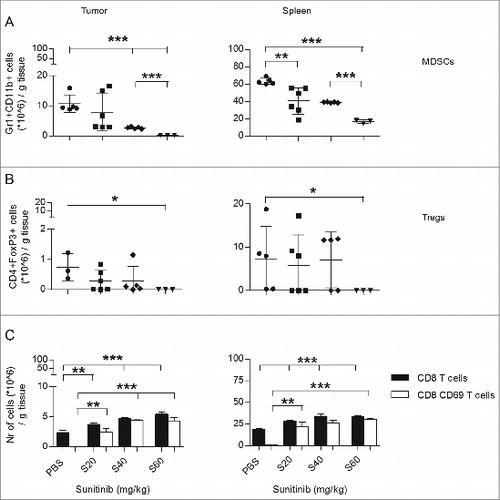
Figure 1. The effect of sunitinib treatment on intratumoral MDSC, Tregs, CD8+ T cells and activation status of the CD8 T cell population. C57Bl6 mice were subcutaneously inoculated with TC-1 tumor cells (n = 3–6 mice/group). On day 15 after tumor inoculation, sunitinib treatment was started, daily, i.p., for a period of 9 consecutive days. Three increasing dosages of sunitinib were used: 20, 40 and 60 mg/kg body weight. Mice were sacrificed and tumors and spleens were harvested. The levels of (A) MDSCs (CD11b+Gr1+), (B) Tregs (CD4+FoxP3+), (C) CD8+ T cells (CD8+; black bars) and the activation status of CD8+ T cells (CD69+; white bars) were analyzed by immunostaining and multicolor fluorescence cytometry. Experiments were repeated twice. Shown here are averages and SD for each experimental group (*p < 0.05; **p < 0.01; ***p < 0.001).

Figure 2. Therapeutic immunization and sunitinib enhance intratumoral and intrasplenic levels of total CD8+ T cells, but not MDSC and Tregs. Mice were s.c. inoculated with TC-1 tumor cells (n = 3 mice/group). On day 14 after tumor inoculation mice were vaccinated once, i.m., with 5 × 10⁶ SFVeE6,7 particles. One day later, sunitinib treatment of 20 and 40 mg/kg body weight was started, i.p., for a period of 9 consecutive days. The levels of (A) MDSCs (Gr1+CD11b+), (B) Tregs (CD4+FoxP3+), (C) activated total CD8+ T cells (CD8+CD69+), and (D) activated E7-antigen specific CD8+ T cells (CD8+E7+CD69+) in tumors and spleens were analyzed by immunostaining and fluorescence cytometry on day 24. Experiments were repeated twice. Shown here are averages and SD for each experimental group (*p < 0.05).
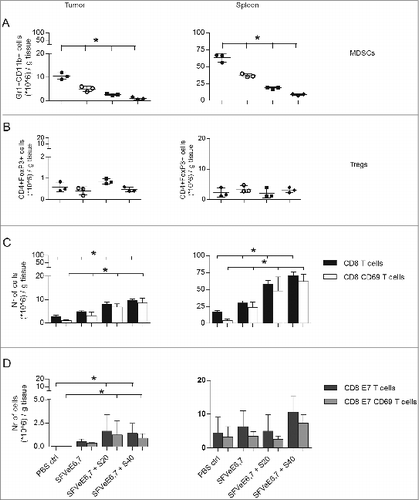
Figure 2. Therapeutic immunization and sunitinib enhance intratumoral and intrasplenic levels of total CD8+ T cells, but not MDSC and Tregs. Mice were s.c. inoculated with TC-1 tumor cells (n = 3 mice/group). On day 14 after tumor inoculation mice were vaccinated once, i.m., with 5 × 10⁶ SFVeE6,7 particles. One day later, sunitinib treatment of 20 and 40 mg/kg body weight was started, i.p., for a period of 9 consecutive days. The levels of (A) MDSCs (Gr1+CD11b+), (B) Tregs (CD4+FoxP3+), (C) activated total CD8+ T cells (CD8+CD69+), and (D) activated E7-antigen specific CD8+ T cells (CD8+E7+CD69+) in tumors and spleens were analyzed by immunostaining and fluorescence cytometry on day 24. Experiments were repeated twice. Shown here are averages and SD for each experimental group (*p < 0.05).

Figure 3. MDSCs isolated from tumors of TC-1 tumor-bearing mice suppress the anti-tumoral activity of CD8+ T cells. TC1 tumor-bearing mice (n = 5–7 mice/group) were divided in two subgroups, the first subgroup receiving PBS and the second receiving 40 mg/kg body weight sunitinib, i.p., for a period of nine consecutive days. At the end of the experiment, intratumoral MDSCs were isolated and positively sorted (CD11b+Gr1+). A separate group of mice received 2 SFVeE6,7 immunizations, in a dosage of 5 × 10⁶ particles, on days 0 and 14. This group of mice was then sacrificed 10 days later and splenocytes were isolated and co-cultured with different ratios of MDSCs (isolated from the first two subgroups and positively sorted) for a period of 7 days. (A) A 51Chromium release assay was performed to determine the suppressive effect of MDSCs. The target cells used in this assay were C3 tumor cells expressing the full HPV16 genome. (B) On day 4 of co-culture, a portion of the cells were labeled with carboxyfluorescein succinimidyl ester (CFSE). On day 7 of co-culture, the E7-antigen specific CD8+ T-cell proliferation was determined by multicolor fluorescence cytometry. Experiments were repeated twice. Shown here are averages and SD for each experimental group (*p < 0.05; ***p < 0.001).
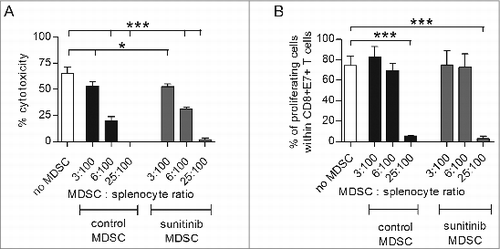
Figure 3. MDSCs isolated from tumors of TC-1 tumor-bearing mice suppress the anti-tumoral activity of CD8+ T cells. TC1 tumor-bearing mice (n = 5–7 mice/group) were divided in two subgroups, the first subgroup receiving PBS and the second receiving 40 mg/kg body weight sunitinib, i.p., for a period of nine consecutive days. At the end of the experiment, intratumoral MDSCs were isolated and positively sorted (CD11b+Gr1+). A separate group of mice received 2 SFVeE6,7 immunizations, in a dosage of 5 × 10⁶ particles, on days 0 and 14. This group of mice was then sacrificed 10 days later and splenocytes were isolated and co-cultured with different ratios of MDSCs (isolated from the first two subgroups and positively sorted) for a period of 7 days. (A) A 51Chromium release assay was performed to determine the suppressive effect of MDSCs. The target cells used in this assay were C3 tumor cells expressing the full HPV16 genome. (B) On day 4 of co-culture, a portion of the cells were labeled with carboxyfluorescein succinimidyl ester (CFSE). On day 7 of co-culture, the E7-antigen specific CD8+ T-cell proliferation was determined by multicolor fluorescence cytometry. Experiments were repeated twice. Shown here are averages and SD for each experimental group (*p < 0.05; ***p < 0.001).

Figure 4. Combination of sunitinib and therapeutic vaccination abrogates tumor growth. Mice (n = 4–6/group) were s.c. inoculated with TC-1 tumor cells. On day 7 after tumor inoculation, sunitinib treatment was started, daily, i.p., for a period of 9 consecutive days. Mice where then immunized with SFVeE6,7 i.m., either on days 14 and 21 after tumor inoculation with a dosage of 5 × 10⁶ particles, or on days 14, 21, and 28 with a dosage of 1 × 10⁶ particles, respectively. Tumor measurements were performed periodically; when tumor size exceeded 1000 mm3 or when tumors protruded through the skin (#) mice were sacrificed due to ethical reasons. Experiments were repeated at least twice. Shown here are the tumor growth curves for each experimental group, per mouse.
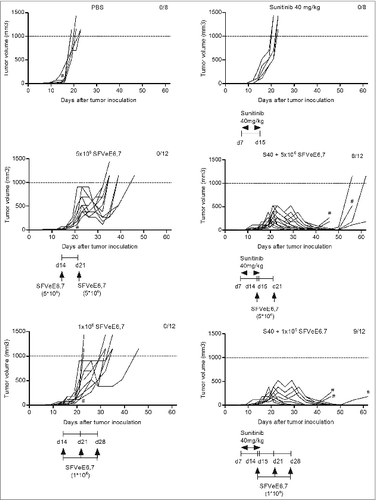
Figure 4. Combination of sunitinib and therapeutic vaccination abrogates tumor growth. Mice (n = 4–6/group) were s.c. inoculated with TC-1 tumor cells. On day 7 after tumor inoculation, sunitinib treatment was started, daily, i.p., for a period of 9 consecutive days. Mice where then immunized with SFVeE6,7 i.m., either on days 14 and 21 after tumor inoculation with a dosage of 5 × 10⁶ particles, or on days 14, 21, and 28 with a dosage of 1 × 10⁶ particles, respectively. Tumor measurements were performed periodically; when tumor size exceeded 1000 mm3 or when tumors protruded through the skin (#) mice were sacrificed due to ethical reasons. Experiments were repeated at least twice. Shown here are the tumor growth curves for each experimental group, per mouse.

Figure 5. Combination of therapeutic immunization and sunitinib stably decreases circulating MDSC levels, enhances levels of E7-specific CD8+ T cells and abrogates tumor growth. Mice (n = 4–6/group) were s.c. inoculated with TC-1 tumor cells. On day 7 after tumor inoculation, sunitinib treatment was started, daily, i.p., for a period of 9 consecutive days. Mice where then immunized with SFVeE6,7 i.m., either on days 14 and 21 after tumor inoculation with a dosage of 5 × 10⁶ particles, or in days 14, 21 and 28 with a dosage of 1 × 10⁶ particles, respectively. (A) The percentage of tumor-free survival was determined at the end of experiments. At specific time intervals, blood was drawn and used to identify the levels of (B) MDSCs (CD11b+Gr1+) and (C) E7-specific CD8+ T cells (E7+CD8+) by immnostaining and fluorescence cytometry. Statistical differences between groups that received sunitinib treatment, alone or in combination with immunization, and groups that received only SFVeE6,7 immunization or PBS are shown. Depicted here are averages and SD for each experimental group (*p < 0.05).
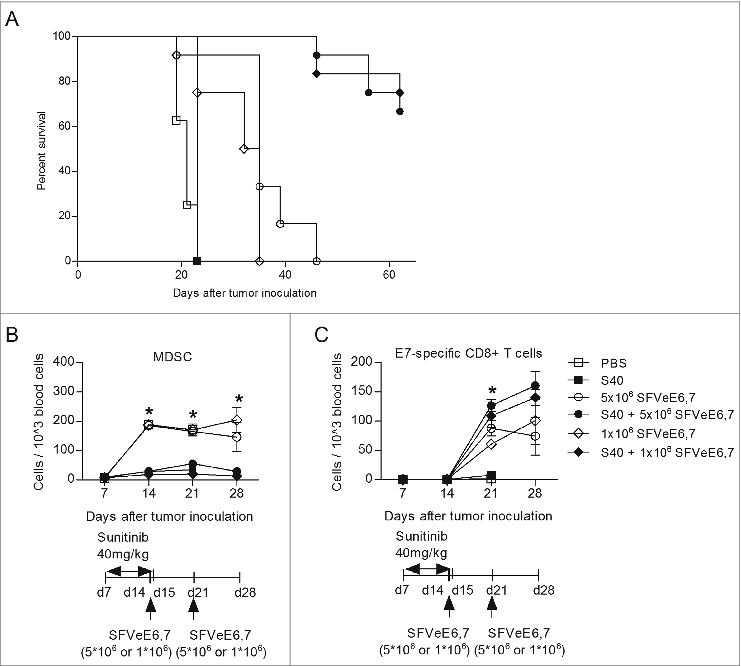
Figure 5. Combination of therapeutic immunization and sunitinib stably decreases circulating MDSC levels, enhances levels of E7-specific CD8+ T cells and abrogates tumor growth. Mice (n = 4–6/group) were s.c. inoculated with TC-1 tumor cells. On day 7 after tumor inoculation, sunitinib treatment was started, daily, i.p., for a period of 9 consecutive days. Mice where then immunized with SFVeE6,7 i.m., either on days 14 and 21 after tumor inoculation with a dosage of 5 × 10⁶ particles, or in days 14, 21 and 28 with a dosage of 1 × 10⁶ particles, respectively. (A) The percentage of tumor-free survival was determined at the end of experiments. At specific time intervals, blood was drawn and used to identify the levels of (B) MDSCs (CD11b+Gr1+) and (C) E7-specific CD8+ T cells (E7+CD8+) by immnostaining and fluorescence cytometry. Statistical differences between groups that received sunitinib treatment, alone or in combination with immunization, and groups that received only SFVeE6,7 immunization or PBS are shown. Depicted here are averages and SD for each experimental group (*p < 0.05).

Table 1. Ratios between total CD8+ T cells or HPV E7-specific CTLs and MDSCs in blood following sunitinib treatment alone or in combination with SFVeE6,7 immunizations at day 28 after tumor inoculation.

Supplemental material

989764_Supplementary_Materials.zip

Download Zip (11.2 MB)