
Figures & data
Figure 1. Adoption percentage of GM crops in Canada.Citation7-10
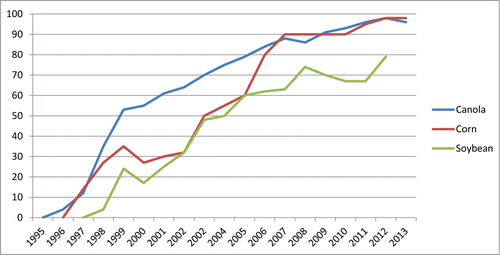
Figure 2. Month-over-month flax exports to the EU (000s tonnes).Citation40
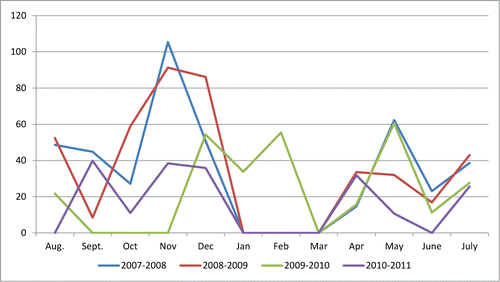
Table 1. Total estimated costs associated with the Triffid event in CanadaCitation40
Figure 1. Adoption percentage of GM crops in Canada.Citation7-10
Figure 2. Month-over-month flax exports to the EU (000s tonnes).Citation40
Table 1. Total estimated costs associated with the Triffid event in CanadaCitation40