Figures & data
Figure 1. Detection of autophagy in EVTs from human subjects in early pregnancy. (a–d) Early chorionic and decidual tissues were obtained from patients who had undergone elective termination at 8 weeks of gestation, and villous explant cultures were performed on Matrigel under hypoxia, 2% oxygen tension (a), and normoxia, 20% oxygen tension (b). HLA-G, one of the markers for EVTs, was expressed on primary cultured trophoblasts in (c). DIC is shown in (d). Arrows indicate MAP1LC3B (LC3) dot formation, a marker of autophagic activation. (e–l) MAP1LC3B staining in normal pregnant subjects at 8 weeks of gestation (e). MAP1LC3B dot formation (g and h, arrows) was detected in the maternal decidua basalis, the implantation site, at a deeper site from the fetus side in square DEC (g), but not at a shallower site from the fetus in the implantation site (f) or in the villous trophoblast region (h, arrowheads). (f–h) Enlarged images of the white squares. (i–l) Double immunohistochemical staining for cytokeratin 7 (KRT7), an EVT marker, (k) and MAP1LC3B (j) revealed that cells with punctated MAP1LC3B were KRT7-positive EVTs (l). (m) Enlarged image of the KRT7-positive EVTs with MAP1LC3B puncta in (l). Hoechst33342 staining, nuclei staining, is shown in (i). Scale bar: 50 µm. STB, syncytiotrophoblasts; CTB, cytotrophoblasts; COL, cell column; DEC, decidua basalis. Electron microscopic images of autophagic structures in HTR8/SVneo cells under hypoxia (n and o). HTR8/SVneo cells, which were cultured under hypoxia for 4 h, were fixed and observed by electron microscopy (×20,000). The smooth endoplasmic reticulum, some destroyed organelles and autophagosomes (Ap) were present (n, arrow). The autophagosome (Ap) had come into contact with multiple vesicle bodies (Mb) (o, arrow). AL, autolysosome; M, mitochondria.
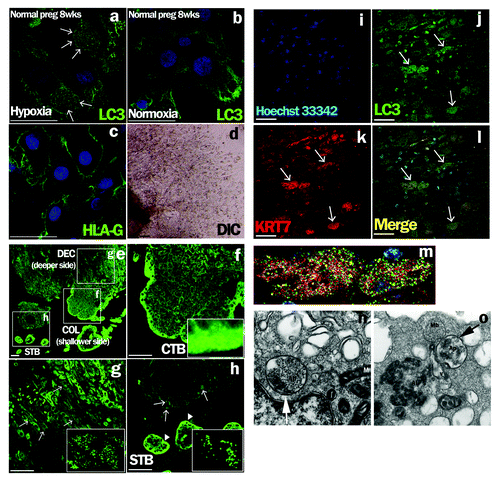
Figure 2. Activation of autophagy in EVT cells under hypoxia. (A) The number of MAP1LC3B (LC3) puncta in HTR8/SVneo cells, infected with the GFP-MAP1LC3B adenovirus vector, in the presence of E64d and pepstatin under 20% (Cont), starvation (Starved) or 2% oxygen tension (hypoxia) for 24 h. (B) The proportion of autophagic cells, identified as cells containing more than 5 MAP1LC3B puncta, among HTR8/SVneo cells in the presence of E64d and pepstatin under 2% oxygen tension for 48 h. (C) Western blots in HTR8/SVneo cells under normoxia and hypoxia (2% oxygen tension) are shown as follows: MAP1LC3B (LC3), HIF1A, SQSTM1 and TUBA1A. Expression of MAP1LC3B-II was examined in the presence or absence of E64d and pepstatin under normoxia and hypoxia (2% oxygen tension). Nor, normoxia; Hyp, hypoxia. (D) Intracellular MAP1LC3B levels determined by flow cytometry. The amount of MAP1LC3B was estimated at 4 and 24 h under 2% oxygen tension (hypoxia) in HTR8/SVneo cells.
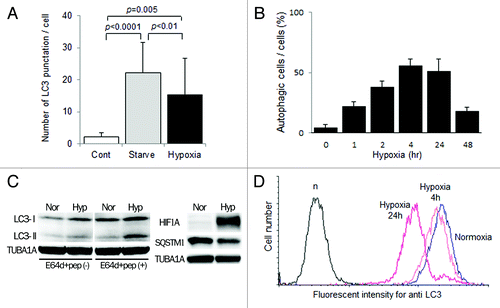
Figure 3. Confirmation of autophagy-deficient cells. (A) Representative panels show mStrawberry (red), anti-MAP1LC3B (LC3) (green) and merged images (lower panels) in HTR8-ATG4BC74A (ATG4BC74A: left panels), an autophagy-deficient EVT cell line, and HTR8-mStrawberry cells (mStrawberry: right panels) under hypoxia for 24 h. (B) Western blots in HTR8-ATG4BC74A and -mStrawberry cells under normoxia and hypoxia (2% oxygen tension) are shown as follows: MAP1LC3B (LC3), SQSTM1, HIF1A and TUBA1A. (C) SQSTM1 expression in HTR8-ATG4BC74A and -mStrawberry cells under normoxia (white bars) and hypoxia (black bars) estimated by ELISA. Results were normalized per milligram of protein from cell lysate. (D) An in vitro invasion assay model before 12 weeks of gestation. Hypoxia (2% oxygen tension) was similar to the placental pO2 level before 12 weeks of gestation. Invasion assays were performed with HchEpC1b-ATG4BC74A or -mStrawberry cells under normoxia (gray bars) or hypoxia (black bars) for 48 h. The Y-axis indicates the number of invading cells. Data were normalized to 1 for normoxia at 24 h. (E) Three-dimensional invasion assays were performed with HchEpC1b-ATG4BC74A or -mStrawberry cells under normoxia (gray bars) and hypoxia (black bars) for 48 h. Photographs show the invading cells (mStrawberry) at the incision face of the gel, in which cells were seeded. The Y-axis indicates the depth of invasion from the surface of the gel. Scale bar: 300 μm.
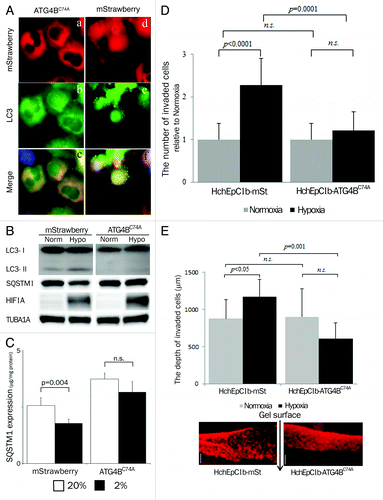
Figure 4. Tube formation assay in the HUVEC and EVT coculture system. The tube formation assay was used as an in vitro model of vascular remodeling after 12 weeks of gestation. Hypoxia (8% oxygen tension) was similar to the placental pO2 level after 12 weeks of gestation. Tube formation assays with human umbilical vein endothelial cells (HUVECs, b, e, h, k, labeled with green) with HTR8-ATG4BC74A (g and j, labeled with red), an autophagy-deficient EVT cell line, or HTR8-mStrawberry cells (a and d, labeled with red) were performed under 8% oxygen tension for 6 or 12 h. Representative merged images are shown from cultures for 6 h (c and i) or 12 h (f and l). Representative figures in the lower panels show single cell cultures, HTR8-mStrawberry cells (m), HTR8-ATG4BC74A cells (n) or HUVECs (o). (p) The graph shows the HTR8 (red) area as a proportion of the total area (red and green). *p < 0.001: the proportion in HTR8-mStrawberry and HUVECs (blue line) was significantly higher than that in HTR8-ATG4BC74A and HUVECs (red line). Data are shown as the mean ± S. E. for three independent experiments. Scale bar: 300 μm.
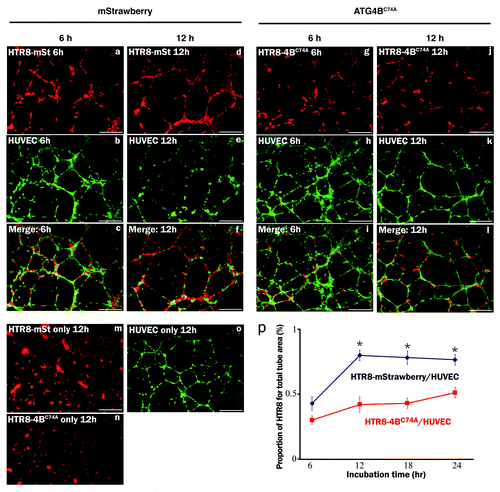
Figure 5. sENG inhibited autophagy in EVT cells under hypoxia. (A) The numbers of MAP1LC3B (LC3) puncta in HchEpC1b-mStrawberry cells in the presence of 5 ng/ml TNF, 5 ng/ml TGFB1, 100 ng/ml sENG or 5 μg/ml sFLT1 with E64d and pepstatin under 2% oxygen tension for 24 h. (B) The numbers of MAP1LC3B puncta in HchEpC1b-mStrawberry cells in the presence of 100 ng/ml sENG without E64d and pepstatin under 20% or 2% oxygen tension for 24 h. Representative figures show MAP1LC3B staining in HchEpC1b-mStrawberry cells in the presence or absence of 100 ng/ml sENG under 2% oxygen tension. (C) Western blot analysis showed that MAP1LC3B-II expression was not enhanced in hypoxic conditions in the presence of 100 ng/ml sENG. (D) The amount of MAP1LC3B in HchEpC1b-mStrawberry cells under 20% oxygen tension (normoxia), 2% oxygen tension (hypoxia) or 2% oxygen tension in the presence of 100 ng/ml sENG (hypoxia with sENG). n, negative control. Data are represented as means ± S.E. n.s., not significant. Statistical significance was calculated using the Mann-Whitney U test.
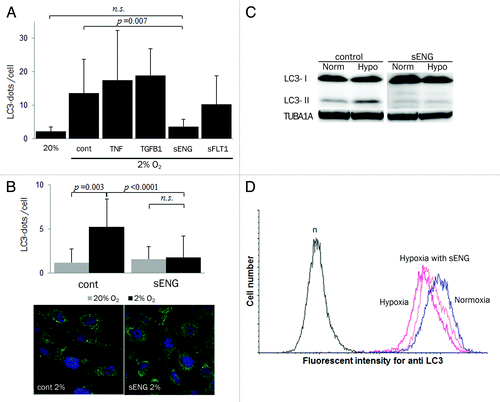
Figure 6. sENG inhibited EVT invasion and vascular remodeling. (A) Invasion assays were performed with HchEpC1b-ATG4BC74A, an autophagy-deficient EVT cell line, or HchEpC1b-mStrawberry cells in the presence or absence of 100 ng/ml sENG under 2% oxygen tension for 48 h. The Y-axis indicates the number of invading cells. Data were normalized to 1 for the control at 48 h. (B) HchEpC1b-mStrawberry cells were treated with 100 ng/ml sENG and several doses of TGFB1 under 2% oxygen tension for 48 h. Data were normalized to 1 for the control at 48 h. (C) Tube formation assays by HUVECs with HchEpC1b-mStrawberry cells were performed under 8% oxygen tension for 24 h in the presence of 0, 125, 250 or 500 ng/ml sENG. The quantification of total tube area formed with dual cell lines was evaluated at 24 h. (D) Representative figures of tube formation by HUVECs (green) with HTR8-ATG4BC74A (red) or HTR8-mStrawberry cells (red) in the presence (f and h) or absence (e and g) of 100 ng/ml sENG under 8% oxygen tension for 12 h. (i and j) The graphs show the HTR8 (red) area as a proportion of the total area in the HTR8-mStrawberry cells and HUVECs (i) or HTR8-ATG4BC74A cells and HUVECs (j). *p < 0.001: the proportion in HTR8-mStrawberry and HUVECs control (blue solid line) is significantly higher than that in HTR8-mStrawberry and HUVECs with 100 ng/ml sENG (blue dotted line). There was no significant difference between the HTR8-ATG4BC74A and HUVECs control (red solid line) and the HTR8-ATG4BC74A and HUVECs with 100 ng/ml sENG (red dotted line). Data are shown as the mean ± S.E. for three independent experiments. Scale bar: 300 μm. n.s., not significant.

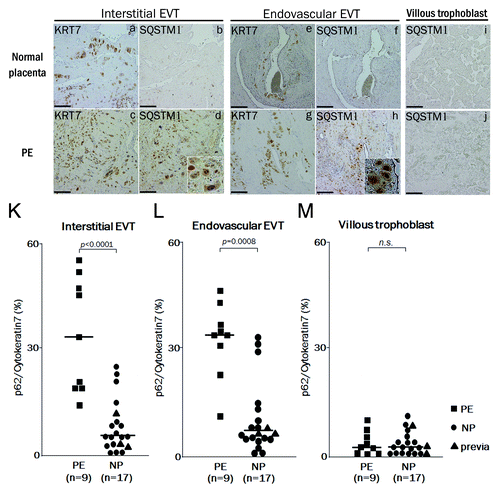
Figure 7. The expression of SQSTM1 in EVTs in preeclamptic placentas. Representative panels show the expression of cytokeratin 7 (KRT7) and SQSTM1 in placental bed biopsies in normal placenta (NP) and preeclamptic placenta (PE) by immunohistochemistry. Four panels on the left show the interstitial EVTs (a–d), four panels in the center show the endovascular EVT (e–h) and two panels on the right show the villous region (I and j). (d and h) Enlarged images of the SQSTM1-positive cells. KRT7 staining, indicating EVTs, was performed in (a, c, e and g). SQSTM1 staining, a marker of autophagic inhibition, was performed in (b, d, f, and h–j). KRT7-positive cells in the myometrium around the vessels were counted as endovascular EVTs, and those in the myometrium without vessels, as interstitial EVTs. (K and L) The graphs show ratios of SQSTM1-positive cells to KRT7-positive cells in the interstitial EVTs (K), in the endovascular EVTs (L) and in the villous trophoblast (M) between preeclampsia (PE, n = 9) and normal pregnancy (NP, n = 17). Dots indicate the ratios of individuals, and bars indicate the median values. Square, PE; Circles, NP and triangles, placenta previa. Scale bar: 50 µm.