1,421
Views
41
CrossRef citations to date
0
Altmetric
Basic Research Paper

A chimerical phagocytosis model reveals the recruitment by Sertoli cells of autophagy for the degradation of ingested illegitimate substrates

, , , , , , , , , & show all
Pages 653-666 | Received 06 Sep 2012, Accepted 31 Jan 2013, Published online: 25 Feb 2013

Figures & data

Figure 1. Phagocytosis of RB or POS increases MERTK phosphorylation and is stimulated by MERTK ligand, PROS1. (A) Sertoli cells (blue stained nuclei with DAPI), exposed to RB or POS (red stained particles) bind and ingest both substrates. (B) Western blotting analysis of MERTK phosphorylation in Sertoli cells exposed to either RB or POS with a graph representing MERTK phosphorylation normalized to total MERTK level, **p < 0.001 by ANOVA with Bonferroni post hoc analysis. (C) Depicts a quantitative analysis of bound and total (bound + ingested) POS or RB. Phagocytosis index was calculated for Sertoli cell cultures exposed to either RB or POS in the absence or in the presence of 200 nM of MERTK ligand PROS1; **p < 0.001 by ANOVA with Bonferroni post-hoc analysis. (D) Binding of POS (red stained particles) to Sertoli cells (blue stained nuclei with DAPI) and the inhibition by ANXA5 of POS binding to Sertoli cells. The effects of ANXA5 (green staining) on RB binding to Sertoli cells is represented and should be compared with data depicted in (A). The panel labeled “Rhodopsin + DAPI” means that POS were first treated with ANXA5-coupled FITC then they were added to Sertoli cell cultures for 2 h and then anti-Rhodopsin staining was performed. Comparisons are made between panels 1, 2 and 3 showing that ANXA5-treated POS do not bind to Sertoli cells and between panels 3 and 5 showing that ANXA5-treated RB are bound to Sertoli cells. Scale bar: 5 μm.
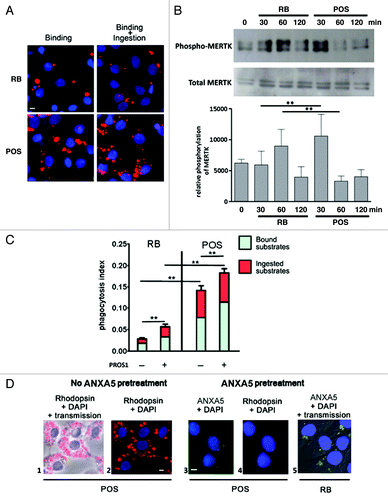
Figure 1. Phagocytosis of RB or POS increases MERTK phosphorylation and is stimulated by MERTK ligand, PROS1. (A) Sertoli cells (blue stained nuclei with DAPI), exposed to RB or POS (red stained particles) bind and ingest both substrates. (B) Western blotting analysis of MERTK phosphorylation in Sertoli cells exposed to either RB or POS with a graph representing MERTK phosphorylation normalized to total MERTK level, **p < 0.001 by ANOVA with Bonferroni post hoc analysis. (C) Depicts a quantitative analysis of bound and total (bound + ingested) POS or RB. Phagocytosis index was calculated for Sertoli cell cultures exposed to either RB or POS in the absence or in the presence of 200 nM of MERTK ligand PROS1; **p < 0.001 by ANOVA with Bonferroni post-hoc analysis. (D) Binding of POS (red stained particles) to Sertoli cells (blue stained nuclei with DAPI) and the inhibition by ANXA5 of POS binding to Sertoli cells. The effects of ANXA5 (green staining) on RB binding to Sertoli cells is represented and should be compared with data depicted in (A). The panel labeled “Rhodopsin + DAPI” means that POS were first treated with ANXA5-coupled FITC then they were added to Sertoli cell cultures for 2 h and then anti-Rhodopsin staining was performed. Comparisons are made between panels 1, 2 and 3 showing that ANXA5-treated POS do not bind to Sertoli cells and between panels 3 and 5 showing that ANXA5-treated RB are bound to Sertoli cells. Scale bar: 5 μm.

Figure 2. Sertoli cells engulf RB or POS via pseudopod protrusions, driven by small GTPase RAC1. In (A and B), EM images showing engulfment of either RB (A) or POS (B) via pseudopod protrusions as indicated by the arrows. In (C–F), immunostaining and confocal microscopy analysis of RAC1 activation (GTP-RAC1 staining) in either untreated Sertoli cells or in Sertoli cells exposed to either RB or POS, in (C), transmission pictures were merged with DAPI stained nuclei (blue), in (D) with GTP-RAC1 staining (red), in (E) with both DAPI staining and (blue) and GTP-RAC1 or in (F) dark–field of DAPI staining (blue) and GTP-RAC1. In (G), confocal microscopy slicing of GTP-RAC1 staining of Sertoli cells exposed to either RB or POS. In (H), a graph representing fold increase of RAC1 activation in Sertoli cells either not exposed to- or after 2 h exposure to either POS or RB. Abbreviations: m, mitochondrion; n, nucleus; v, degradative vacuole. Scale bars: (A and B) 1 μm; (C–F) 5 μm.
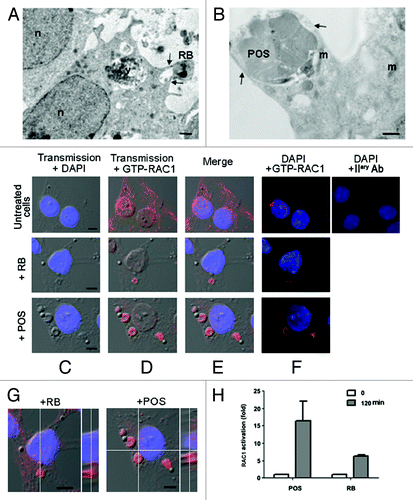
Figure 2. Sertoli cells engulf RB or POS via pseudopod protrusions, driven by small GTPase RAC1. In (A and B), EM images showing engulfment of either RB (A) or POS (B) via pseudopod protrusions as indicated by the arrows. In (C–F), immunostaining and confocal microscopy analysis of RAC1 activation (GTP-RAC1 staining) in either untreated Sertoli cells or in Sertoli cells exposed to either RB or POS, in (C), transmission pictures were merged with DAPI stained nuclei (blue), in (D) with GTP-RAC1 staining (red), in (E) with both DAPI staining and (blue) and GTP-RAC1 or in (F) dark–field of DAPI staining (blue) and GTP-RAC1. In (G), confocal microscopy slicing of GTP-RAC1 staining of Sertoli cells exposed to either RB or POS. In (H), a graph representing fold increase of RAC1 activation in Sertoli cells either not exposed to- or after 2 h exposure to either POS or RB. Abbreviations: m, mitochondrion; n, nucleus; v, degradative vacuole. Scale bars: (A and B) 1 μm; (C–F) 5 μm.

Figure 3. Analysis of changes in phospho-MERTK, MAP1LC3A-II and myosin II distribution in RB-or POS-exposed Sertoli cell cultures. Sertoli cell cultures either untreated or exposed to either POS or RB were stained for phospho-MERTK (green) (B) and myosin II (red) (C), in (D) merged images for phospho-MERTK and myosin II staining. DAPI stained nuclei are in blue. In the absence of POS and RB, phospho-MERTK distributes homogenously throughout Sertoli cell and myosin II distributed commonly in the cytoplasm and within cell boundaries. Within 2 h of Sertoli cell culture exposure to either RB or POS, phospho-MERTK redistributes forming clusters (B, arrowheads). While in RB-exposed Sertoli cells both peripheral myosin II and myosin II clumps are detected, in POS-exposed Sertoli cells only myosin II clumps but no peripheral myosin II were detected (C, arrows). (D) Shows phospho-MERTK clusters and myosin II clumps that colocalize on the site of Sertoli cell contact with either RB or POS. (E) Shows colocalization of MAP1LC3A-II with myosin II in POS-exposed but not RB-exposed Sertoli cell cultures. No clustering of MAP1LC3A-II was observed in control untreated Sertoli cells. Scale bar: 5 μm. (F) Depicts western blotting analysis of total cell lysates or MAP1LC3A-immunoprecipitated cell lysates showing that the co-immunoprecipitation of myosin II with MAP1LC3A occurs only in POS-exposed but not in RB-exposed Sertoli cell.
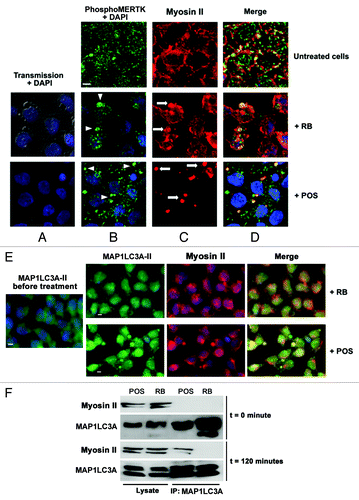
Figure 3. Analysis of changes in phospho-MERTK, MAP1LC3A-II and myosin II distribution in RB-or POS-exposed Sertoli cell cultures. Sertoli cell cultures either untreated or exposed to either POS or RB were stained for phospho-MERTK (green) (B) and myosin II (red) (C), in (D) merged images for phospho-MERTK and myosin II staining. DAPI stained nuclei are in blue. In the absence of POS and RB, phospho-MERTK distributes homogenously throughout Sertoli cell and myosin II distributed commonly in the cytoplasm and within cell boundaries. Within 2 h of Sertoli cell culture exposure to either RB or POS, phospho-MERTK redistributes forming clusters (B, arrowheads). While in RB-exposed Sertoli cells both peripheral myosin II and myosin II clumps are detected, in POS-exposed Sertoli cells only myosin II clumps but no peripheral myosin II were detected (C, arrows). (D) Shows phospho-MERTK clusters and myosin II clumps that colocalize on the site of Sertoli cell contact with either RB or POS. (E) Shows colocalization of MAP1LC3A-II with myosin II in POS-exposed but not RB-exposed Sertoli cell cultures. No clustering of MAP1LC3A-II was observed in control untreated Sertoli cells. Scale bar: 5 μm. (F) Depicts western blotting analysis of total cell lysates or MAP1LC3A-immunoprecipitated cell lysates showing that the co-immunoprecipitation of myosin II with MAP1LC3A occurs only in POS-exposed but not in RB-exposed Sertoli cell.

Figure 4. Degradation of either RB or POS by Sertoli cells. In (A), electron microscopy analysis showing intact RB, entered Sertoli cell cytoplasm along with partly degraded RB inside degradative vacuoles at different stages of their maturation, filled with electron-dense degradative remnants (arrowheads). Large portions of intact and partly degraded (B–K) Rhodopsin-positive POS membranes (B–E) are detected within Sertoli cell cytoplasm. Intact POS, entered the cytoplasm, are wrapped by double membranes (F and G) and may be directly conveyed into degradative vacuoles (I) (arrowhead), which further mature into late degradative vacuoles delimited by single membrane (B–I) (arrow). The arrow in (F) indicates partly degraded POS fragments, devoid of plasma membrane, wrapped by a phagophore. The arrow in (G) indicates triple membrane; in newly ingested POS, consisting of POS plasma membrane wrapped by a phagophore. Apart from single-membrane limited degradative vacuoles, disintegrated POS are found inside double-membrane limited vacuoles (H). Double-membrane vacuoles are surrounded by small lamellar vacuoles (H) (asterisk). Electron microscopy images from RB and POS-treated Sertoli cells show no sign of cell damage in the nuclei or in the cytoplasm. (J) Represents a higher magnificence image of (G) showing double-membrane wrapped plasma-membrane delimited fragments of undegraded POS (arrows). (K) Represents a higher magnification of (H) showing double-membrane wrapped degraded fragments of POS. Abbreviations: ly, lysosome; m, mitochondrion; n, nucleus. Scale bars: (A, B, F, G, H) 1 μm; (C, D, E, I and J) 5 μm.
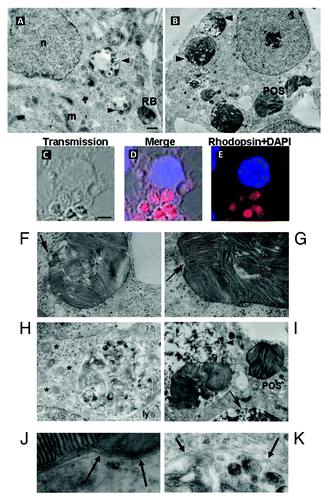
Figure 4. Degradation of either RB or POS by Sertoli cells. In (A), electron microscopy analysis showing intact RB, entered Sertoli cell cytoplasm along with partly degraded RB inside degradative vacuoles at different stages of their maturation, filled with electron-dense degradative remnants (arrowheads). Large portions of intact and partly degraded (B–K) Rhodopsin-positive POS membranes (B–E) are detected within Sertoli cell cytoplasm. Intact POS, entered the cytoplasm, are wrapped by double membranes (F and G) and may be directly conveyed into degradative vacuoles (I) (arrowhead), which further mature into late degradative vacuoles delimited by single membrane (B–I) (arrow). The arrow in (F) indicates partly degraded POS fragments, devoid of plasma membrane, wrapped by a phagophore. The arrow in (G) indicates triple membrane; in newly ingested POS, consisting of POS plasma membrane wrapped by a phagophore. Apart from single-membrane limited degradative vacuoles, disintegrated POS are found inside double-membrane limited vacuoles (H). Double-membrane vacuoles are surrounded by small lamellar vacuoles (H) (asterisk). Electron microscopy images from RB and POS-treated Sertoli cells show no sign of cell damage in the nuclei or in the cytoplasm. (J) Represents a higher magnificence image of (G) showing double-membrane wrapped plasma-membrane delimited fragments of undegraded POS (arrows). (K) Represents a higher magnification of (H) showing double-membrane wrapped degraded fragments of POS. Abbreviations: ly, lysosome; m, mitochondrion; n, nucleus. Scale bars: (A, B, F, G, H) 1 μm; (C, D, E, I and J) 5 μm.

Figure 5. Activation of MAP1LC3A-II, in POS-exposed Sertoli cells. In (A), POS-exposed Sertoli cells show large (arrow) and small (asterisks) vacuoles, which are immunoreactive for Rhodopsin and for MAP1LC3A-II (merge, boxed area). In (B), for RB-exposed Sertoli cells, MAP1LC3A immunostaining distributes homogenously throughout cell cytoplasm and does not colocalize with RB (arrows). In (C), transmission pictures of Sertoli cells exposed to PS-coated polystyrene beads (unstained) merged with DAPI (blue) stained nuclei, showing that both 1 μm and 5 μm diameter particles bind to- and are ingested by- Sertoli cell. Sertoli cell exposure to beads of either sizes, induces myosin-II clumping (arrowheads) but not MAP1LC3A-clustering. In (D), EM images showing that both 1 μm and 5 μm diameter particles were ingested by Sertoli cells but did not lead in either cases to double-membrane formation. In (E), western blotting analysis of changes in the expression level of BECN1, ATG5 and ATG9 in Sertoli cells exposed to either POS or RB as compared with control Sertoli cells not exposed to either substrates. In F, western blotting analysis of a time-course of SQSTM1 protein degradation in Sertoli cells exposed to either POS or RB. Scale bar: (A–C) 5 μm.
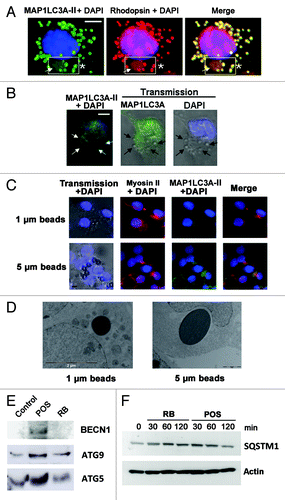
Figure 5. Activation of MAP1LC3A-II, in POS-exposed Sertoli cells. In (A), POS-exposed Sertoli cells show large (arrow) and small (asterisks) vacuoles, which are immunoreactive for Rhodopsin and for MAP1LC3A-II (merge, boxed area). In (B), for RB-exposed Sertoli cells, MAP1LC3A immunostaining distributes homogenously throughout cell cytoplasm and does not colocalize with RB (arrows). In (C), transmission pictures of Sertoli cells exposed to PS-coated polystyrene beads (unstained) merged with DAPI (blue) stained nuclei, showing that both 1 μm and 5 μm diameter particles bind to- and are ingested by- Sertoli cell. Sertoli cell exposure to beads of either sizes, induces myosin-II clumping (arrowheads) but not MAP1LC3A-clustering. In (D), EM images showing that both 1 μm and 5 μm diameter particles were ingested by Sertoli cells but did not lead in either cases to double-membrane formation. In (E), western blotting analysis of changes in the expression level of BECN1, ATG5 and ATG9 in Sertoli cells exposed to either POS or RB as compared with control Sertoli cells not exposed to either substrates. In F, western blotting analysis of a time-course of SQSTM1 protein degradation in Sertoli cells exposed to either POS or RB. Scale bar: (A–C) 5 μm.

Figure 6. Bafilomycin A1 and Atg5 silencing modify Sertoli cell response to POS exposure. In (A), western blot analysis of SQSTM1 protein levels in primary Sertoli cell culture preparations exposed to either POS, bafilomycin A1 or a combination of these. In (B), Rhodopsin (POS) and MAP1LC3A-II immunostaining (clustering) in POS-exposed Sertoli cell cultures in the absence (upper panel) or presence (lower panel) of bafilomycin A1. In (C), western blotting analysis depicting changes in SQSTM1, ATG5 and actin levels in POS-exposed murine Sertoli cell line (TM4) in the presence of either the transfection agent (vehicle) or that were transected with scrambled siRNA (Scr siRNA) or Atg5 siRNA. In (D), rhodopsin distribution in murine Sertoli cell line (TM4) after 2 h exposure to POS in either scrambled siRNA- or Atg5siRNA- transfected cells. In (E), phagocytosis index of total POS (bound + ingested) after 2 h exposure of murine TM4 Sertoli cell line that were either untreated (NT) or exposed to transfection agent (vehicle) or transfected with either a scrambled siRNA (Scr RNA) or with Atg5 siRNA.
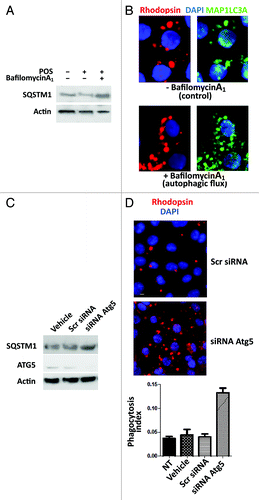
Figure 6. Bafilomycin A1 and Atg5 silencing modify Sertoli cell response to POS exposure. In (A), western blot analysis of SQSTM1 protein levels in primary Sertoli cell culture preparations exposed to either POS, bafilomycin A1 or a combination of these. In (B), Rhodopsin (POS) and MAP1LC3A-II immunostaining (clustering) in POS-exposed Sertoli cell cultures in the absence (upper panel) or presence (lower panel) of bafilomycin A1. In (C), western blotting analysis depicting changes in SQSTM1, ATG5 and actin levels in POS-exposed murine Sertoli cell line (TM4) in the presence of either the transfection agent (vehicle) or that were transected with scrambled siRNA (Scr siRNA) or Atg5 siRNA. In (D), rhodopsin distribution in murine Sertoli cell line (TM4) after 2 h exposure to POS in either scrambled siRNA- or Atg5siRNA- transfected cells. In (E), phagocytosis index of total POS (bound + ingested) after 2 h exposure of murine TM4 Sertoli cell line that were either untreated (NT) or exposed to transfection agent (vehicle) or transfected with either a scrambled siRNA (Scr RNA) or with Atg5 siRNA.