1,668
Views
49
CrossRef citations to date
0
Altmetric
Basic Research Paper

Autophagy and formation of tubulovesicular autophagosomes provide a barrier against nonviral gene delivery

, , , , , , , & show all
Pages 667-682 | Received 14 May 2012, Accepted 04 Feb 2013, Published online: 19 Feb 2013

Figures & data

Figure 1. Cationic lipoplex, polyplex and calcium phosphate precipitates induce formation of tubulovesicular autophagosomes. CHO cells expressing GFP-LC3 were used to monitor autophagosome formation. Nuclei were stained with DAPI. Scale bar: 10 μm. (A) Cells were incubated in nutrient media (i), or starved in HBSS (ii). When incubated in nutrient media containing cationic lipoplex (iii) calcium phosphate precipitate complexed with DNA (iv) or polyplex. (B) Different cell types were incubated with lipoplex (Transfast) and immunostained for endogenous LC3 after 4 h. HeLa cells (i), Vero cells (ii), murine embryonic fibroblasts (iii), primary culture of murine dendritic cells. (C) Primary cultures of murine skin fibroblasts were incubated in starved in HBSS for 4 h (i) or incubated with lipoplex for 4 h (ii) and immunostained for endogenous LC3 (green). Insets show region of interest at higher magnification. (iii) CHO cells expressing GFP-LC3 were electroporated in the presence of a plasmid expressing LAMP1-RFP and MEF cells were electroporated in the presence of a plasmid expressing GFP. LC3 distribution (gray) was analyzed in cells expressing the reporter proteins 7 h after electroporation. (D). MEFs were transfected with a plasmid expressing human GABARAPL2 tagged with GFP (green).Citation14 Cells were incubated in nutrient media (i), starved in HBSS for 4 h (ii) or incubated with lipoplex (iii) and immunostained for endogenous LC3 (red) after 4 h. Insets show region of interest at higher magnification.
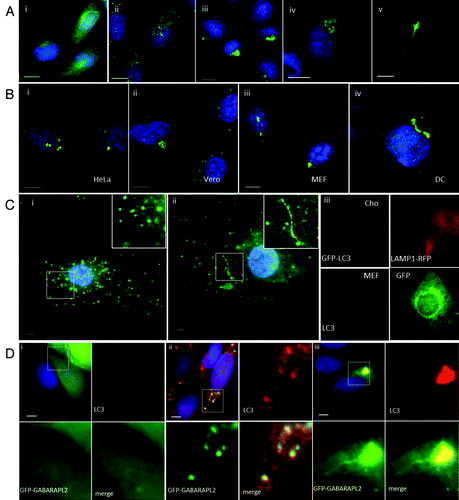
Figure 1. Cationic lipoplex, polyplex and calcium phosphate precipitates induce formation of tubulovesicular autophagosomes. CHO cells expressing GFP-LC3 were used to monitor autophagosome formation. Nuclei were stained with DAPI. Scale bar: 10 μm. (A) Cells were incubated in nutrient media (i), or starved in HBSS (ii). When incubated in nutrient media containing cationic lipoplex (iii) calcium phosphate precipitate complexed with DNA (iv) or polyplex. (B) Different cell types were incubated with lipoplex (Transfast) and immunostained for endogenous LC3 after 4 h. HeLa cells (i), Vero cells (ii), murine embryonic fibroblasts (iii), primary culture of murine dendritic cells. (C) Primary cultures of murine skin fibroblasts were incubated in starved in HBSS for 4 h (i) or incubated with lipoplex for 4 h (ii) and immunostained for endogenous LC3 (green). Insets show region of interest at higher magnification. (iii) CHO cells expressing GFP-LC3 were electroporated in the presence of a plasmid expressing LAMP1-RFP and MEF cells were electroporated in the presence of a plasmid expressing GFP. LC3 distribution (gray) was analyzed in cells expressing the reporter proteins 7 h after electroporation. (D). MEFs were transfected with a plasmid expressing human GABARAPL2 tagged with GFP (green).Citation14 Cells were incubated in nutrient media (i), starved in HBSS for 4 h (ii) or incubated with lipoplex (iii) and immunostained for endogenous LC3 (red) after 4 h. Insets show region of interest at higher magnification.

Figure 2. Tubulovesicular autophagosomes generate tubular extensions and require microtubules (see Vids. S1–S3). (A and B) CHO cells expressing GFP-LC3 were incubated in nutrient media containing cationic lipoplex for the duration of the experiment. Images were captured from live cells at the indicated times. (C) The cells were imaged in the presence of 20 μg/ml cycloheximide. (D) CHO cells expressing GFP-LC3 were incubated in nutrient media containing cationic lipoplex (i) or cationic lipoplex and 5 mM nocodazole (ii) for 4 h, fixed and immunostained for tubulin (red).
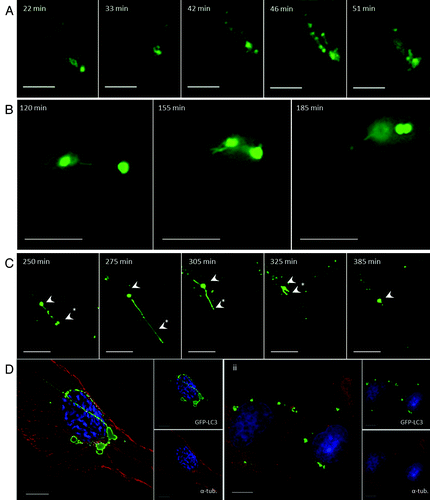
Figure 2. Tubulovesicular autophagosomes generate tubular extensions and require microtubules (see Vids. S1–S3). (A and B) CHO cells expressing GFP-LC3 were incubated in nutrient media containing cationic lipoplex for the duration of the experiment. Images were captured from live cells at the indicated times. (C) The cells were imaged in the presence of 20 μg/ml cycloheximide. (D) CHO cells expressing GFP-LC3 were incubated in nutrient media containing cationic lipoplex (i) or cationic lipoplex and 5 mM nocodazole (ii) for 4 h, fixed and immunostained for tubulin (red).

Figure 3. Role of SQSTM1 and ubiquitin in formation of tubulovesicular autophagosomes. (A) CHO cells expressing GFP-LC3 were incubated in nutrient media containing cationic lipoplex for 10 min (i) or 360 min (ii and iii). Cells were fixed and immunostained for SQSTM1 (i and ii), or ubiquitin (iii). Scale bar: 10 μm. (B) Wild-type MEFs (i and iii) or MEFs from sqstm1−/− knockout mice (ii and iv) were incubated with cationic lipoplex. Cells were either fixed at 1 h (i and ii), or 6 h (iii and iv) and immunostained for endogenous LC3 (green) or SQSTM1 (red).
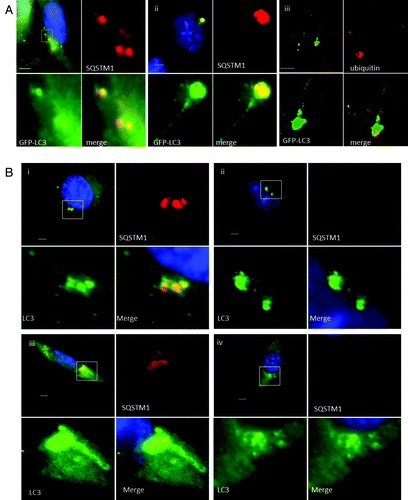
Figure 3. Role of SQSTM1 and ubiquitin in formation of tubulovesicular autophagosomes. (A) CHO cells expressing GFP-LC3 were incubated in nutrient media containing cationic lipoplex for 10 min (i) or 360 min (ii and iii). Cells were fixed and immunostained for SQSTM1 (i and ii), or ubiquitin (iii). Scale bar: 10 μm. (B) Wild-type MEFs (i and iii) or MEFs from sqstm1−/− knockout mice (ii and iv) were incubated with cationic lipoplex. Cells were either fixed at 1 h (i and ii), or 6 h (iii and iv) and immunostained for endogenous LC3 (green) or SQSTM1 (red).

Figure 4. Requirements for tubulovesicular autophagosome formation by cationic lipoplex. (A) MEF cells were incubated for the indicated times in nutrient media (control), HBSS or nutrient media containing cationic lipoplex. Cells lysates were analyzed by SDS-PAGE followed by western blot using antibodies specific for LC3 or ACTB/β-actin. The bands representing LC3-I and LC3-II are indicated. (B) CHO cells expressing GFP-LC3G120A were incubated in nutrient media (i), starved in HBSS (ii), or nutrient media containing lipoplex (iii). Cells were fixed after 4 h. Wild-type MEF cells were incubated in nutrient media (iv), starved in HBSS (v), or nutrient medium containing lipoplex (vi). MEF atg5−/− cells were incubated in nutrient media (vii), starved in HBSS (viii), or nutrient media containing lipoplex (ix). Cells were fixed after 4 h and endogenous LC3 was visualized by immunostaining with antibody specific for LC3. CHO cells expressing GFP-LC3 were incubated in HBSS alone (x) with 100 nM wortmannin in HBSS (xi), or 100 nM wortmannin in nutrient media containing lipoplex (xii). Cells were fixed at the indicated times. Nuclei were stained with DAPI. Scale bar: 10 μm.
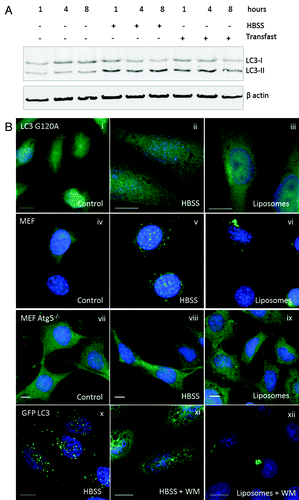
Figure 4. Requirements for tubulovesicular autophagosome formation by cationic lipoplex. (A) MEF cells were incubated for the indicated times in nutrient media (control), HBSS or nutrient media containing cationic lipoplex. Cells lysates were analyzed by SDS-PAGE followed by western blot using antibodies specific for LC3 or ACTB/β-actin. The bands representing LC3-I and LC3-II are indicated. (B) CHO cells expressing GFP-LC3G120A were incubated in nutrient media (i), starved in HBSS (ii), or nutrient media containing lipoplex (iii). Cells were fixed after 4 h. Wild-type MEF cells were incubated in nutrient media (iv), starved in HBSS (v), or nutrient medium containing lipoplex (vi). MEF atg5−/− cells were incubated in nutrient media (vii), starved in HBSS (viii), or nutrient media containing lipoplex (ix). Cells were fixed after 4 h and endogenous LC3 was visualized by immunostaining with antibody specific for LC3. CHO cells expressing GFP-LC3 were incubated in HBSS alone (x) with 100 nM wortmannin in HBSS (xi), or 100 nM wortmannin in nutrient media containing lipoplex (xii). Cells were fixed at the indicated times. Nuclei were stained with DAPI. Scale bar: 10 μm.

Figure 5. Loss of ATG5 results in increases gene delivery from cationic liposomes and polyplex polymers. (A) Control MEFs (black column) or atg5−/− MEFs (white column) were incubated with lipoplex (left) or polyplex (right) complexed with increasing quantities of reporter plasmid expressing luciferase and GFP. The panels show luciferase activity in cell lysates prepared 16 h after transfection. (B) Control MEFs (black column) or atg5−/− MEFs (white column) were incubated with lipoplex or polyplex complexed with 0.5 μg of reporter plasmid as indicated. Luciferase activity was assessed in cell lysates prepared 16 and 24 h after transfection. Expression at 16 h was estimated from three independent experiments and error bars (SE) are shown. (C) Control MEFs (black column) or atg5−/− MEFs (white column) were incubated for 1 h with DOTAP:Chol cationic lipoplex complexed at different charge ratios complexed with 0.25 μg of a reporter plasmid expressing luciferase. Luciferase activity was assessed at 24 h from three independent experiments and error bars (SE) are shown. (D) Control MEFs (top) or atg5−/− MEFs (bottom) were incubated with lipoplex or polyplex vectors complexed with reporter plasmid expressing luciferase and GFP. Sixteen h after transfection cells were sorted for GFP expression and permeability to propidium iodide and gated into four quadrants. UL: dead cells negative for GFP. LL: live cells negative for GFP. UR: dead cell expressing GFP. LR: live cells expressing GFP. (E) Numbers of cells expressing GFP were taken by summing UR and LR quadrants in (G) and multiplied by mean fluorescence intensity. Control MEFs (black column) atg5−/− MEFs (white column). (F) atg5-/- MEFs were transfected with control plasmid (top), or plasmid expressing RFP-ATG5 (bottom). After 24 h the cells were incubated with cationic lipoplex complexed with 0.5 μg of luciferase-GFP reporter plasmid. Cells were sorted at 16 h for GFP expression.
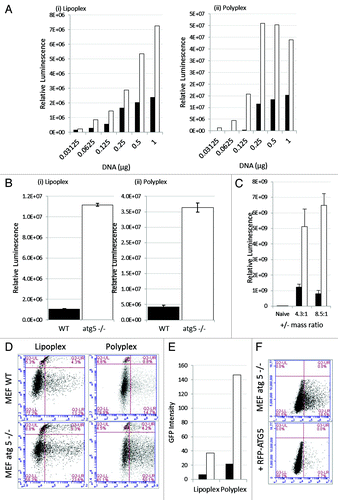
Figure 5. Loss of ATG5 results in increases gene delivery from cationic liposomes and polyplex polymers. (A) Control MEFs (black column) or atg5−/− MEFs (white column) were incubated with lipoplex (left) or polyplex (right) complexed with increasing quantities of reporter plasmid expressing luciferase and GFP. The panels show luciferase activity in cell lysates prepared 16 h after transfection. (B) Control MEFs (black column) or atg5−/− MEFs (white column) were incubated with lipoplex or polyplex complexed with 0.5 μg of reporter plasmid as indicated. Luciferase activity was assessed in cell lysates prepared 16 and 24 h after transfection. Expression at 16 h was estimated from three independent experiments and error bars (SE) are shown. (C) Control MEFs (black column) or atg5−/− MEFs (white column) were incubated for 1 h with DOTAP:Chol cationic lipoplex complexed at different charge ratios complexed with 0.25 μg of a reporter plasmid expressing luciferase. Luciferase activity was assessed at 24 h from three independent experiments and error bars (SE) are shown. (D) Control MEFs (top) or atg5−/− MEFs (bottom) were incubated with lipoplex or polyplex vectors complexed with reporter plasmid expressing luciferase and GFP. Sixteen h after transfection cells were sorted for GFP expression and permeability to propidium iodide and gated into four quadrants. UL: dead cells negative for GFP. LL: live cells negative for GFP. UR: dead cell expressing GFP. LR: live cells expressing GFP. (E) Numbers of cells expressing GFP were taken by summing UR and LR quadrants in (G) and multiplied by mean fluorescence intensity. Control MEFs (black column) atg5−/− MEFs (white column). (F) atg5-/- MEFs were transfected with control plasmid (top), or plasmid expressing RFP-ATG5 (bottom). After 24 h the cells were incubated with cationic lipoplex complexed with 0.5 μg of luciferase-GFP reporter plasmid. Cells were sorted at 16 h for GFP expression.

Figure 6. Gene delivery and formation of tubulovesicular autophagosomes require endocytosis. (A) MEF cells were incubated with cationic lipoplex for 1 h in nutrient media (i), or media with 80 μM dynasore (ii). Cells were immunostained for endogenous LC3. Scale bar: 10 μm. (iii) MEF cells were incubated with lipoplex vector (black) or polyplex (white) complexed to a luciferase reporter plasmid in nutrient media (filled columns) or nutrient media containing 80 μM dynasore (hatched columns). Luciferase activity was assayed at 16 h and 24 h from three independent experiments, error bars (SE) are shown. (B) HEK 293 cells stably expressing GFP-LC3 (green) were incubated with lipoplex vector for 4 h. Cells were fixed and immunostained for clathrin (i, red) or early endosome antigen 1(ii, red). (iii) MEF cells expressing RAB5-RFP (red) were incubated with lipoplex vector for 4 h. Cells were fixed and immunostained for endogenous LC3 (green). MEF cells expressing dominant-negative RAB7T22N (iv) were incubated with lipoplex vector for 4 h. Cells were fixed and immunostained for endogenous LC3 (pseudo-colored green). Regions of interest are indicated by the white square and high magnification images of green, red and merged channels are presented to the right of each figure.

Figure 6. Gene delivery and formation of tubulovesicular autophagosomes require endocytosis. (A) MEF cells were incubated with cationic lipoplex for 1 h in nutrient media (i), or media with 80 μM dynasore (ii). Cells were immunostained for endogenous LC3. Scale bar: 10 μm. (iii) MEF cells were incubated with lipoplex vector (black) or polyplex (white) complexed to a luciferase reporter plasmid in nutrient media (filled columns) or nutrient media containing 80 μM dynasore (hatched columns). Luciferase activity was assayed at 16 h and 24 h from three independent experiments, error bars (SE) are shown. (B) HEK 293 cells stably expressing GFP-LC3 (green) were incubated with lipoplex vector for 4 h. Cells were fixed and immunostained for clathrin (i, red) or early endosome antigen 1(ii, red). (iii) MEF cells expressing RAB5-RFP (red) were incubated with lipoplex vector for 4 h. Cells were fixed and immunostained for endogenous LC3 (green). MEF cells expressing dominant-negative RAB7T22N (iv) were incubated with lipoplex vector for 4 h. Cells were fixed and immunostained for endogenous LC3 (pseudo-colored green). Regions of interest are indicated by the white square and high magnification images of green, red and merged channels are presented to the right of each figure.

Figure 7. Interaction of tubulovesicular autophagosomes with lysosomes. (A) LAMP1-RFP was expressed transiently in CHO-cells expressing GFP-LC3. Cells were incubated with lipoplex and images captured from live cells at the indicated times. The top left quadrant of each panel shows the cell containing a TVA imaged at low magnification with a region of interest indicated by the white square. The top right and bottom left quadrants show the individual green and red signals at higher magnification, and the merge is presented in the bottom right. Arrowheads indicate tubular structures extending from autophagosomes toward neighboring lysosomes. (B) Cells expressing RFP-GFP-LC3 were imaged one (i) and 4 h (ii) after starvation in HBSS. The region of interest is indicated by the white square and high magnification images of green, red and merged channels are presented in the remaining panels of each figure. The arrowhead in (ii) indicates an RFP-LC3 punctate that has lost GFP signal at 4 h. (iii and iv) Cells expressing RFP-GFP-LC3 were imaged 1 (iii) and 4 h (iv) after incubation with cationic lipoplex. The region of interest is indicated by the white square and high magnification images of green, red and merged channels are presented in the remaining panels of each figure. The regions of interest indicate TVAs that retain signals for RFP and GFP.
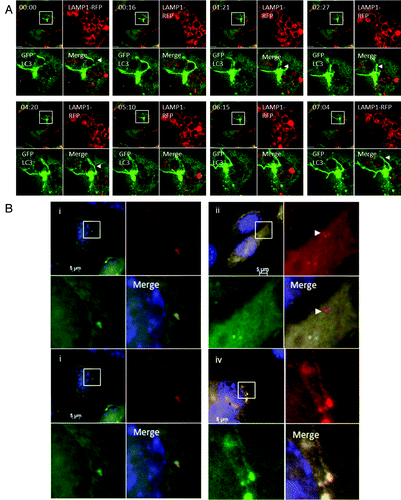
Figure 7. Interaction of tubulovesicular autophagosomes with lysosomes. (A) LAMP1-RFP was expressed transiently in CHO-cells expressing GFP-LC3. Cells were incubated with lipoplex and images captured from live cells at the indicated times. The top left quadrant of each panel shows the cell containing a TVA imaged at low magnification with a region of interest indicated by the white square. The top right and bottom left quadrants show the individual green and red signals at higher magnification, and the merge is presented in the bottom right. Arrowheads indicate tubular structures extending from autophagosomes toward neighboring lysosomes. (B) Cells expressing RFP-GFP-LC3 were imaged one (i) and 4 h (ii) after starvation in HBSS. The region of interest is indicated by the white square and high magnification images of green, red and merged channels are presented in the remaining panels of each figure. The arrowhead in (ii) indicates an RFP-LC3 punctate that has lost GFP signal at 4 h. (iii and iv) Cells expressing RFP-GFP-LC3 were imaged 1 (iii) and 4 h (iv) after incubation with cationic lipoplex. The region of interest is indicated by the white square and high magnification images of green, red and merged channels are presented in the remaining panels of each figure. The regions of interest indicate TVAs that retain signals for RFP and GFP.

Figure 8. Trafficking of cationic lipoplex in endosomes and autophagosomes. CHO cells expressing GFP-LC3 were incubated with Dil-labeled cationic liposomes (red). Images were captured from live cells at the indicated times. (A) Early time points taken at the indicated times after cell entry of liposomes into endosomes at cell periphery (see Vid. S3). (B) Later time points imaged at 200 min as liposomes associate with tubulovesicular autophagosomes.
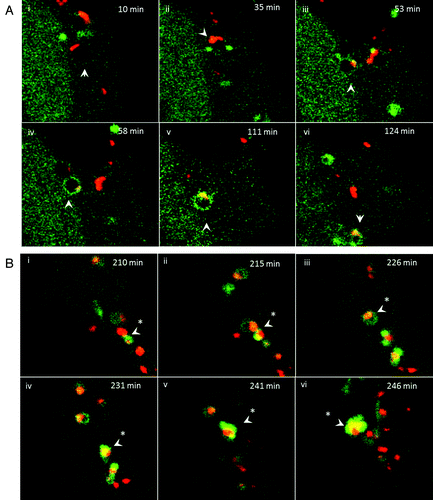
Figure 8. Trafficking of cationic lipoplex in endosomes and autophagosomes. CHO cells expressing GFP-LC3 were incubated with Dil-labeled cationic liposomes (red). Images were captured from live cells at the indicated times. (A) Early time points taken at the indicated times after cell entry of liposomes into endosomes at cell periphery (see Vid. S3). (B) Later time points imaged at 200 min as liposomes associate with tubulovesicular autophagosomes.
Supplemental material

Additional material

Download Zip (3.8 MB)