1,554
Views
60
CrossRef citations to date
0
Altmetric
Basic Research Paper

Energy deprivation by silibinin in colorectal cancer cells

A double-edged sword targeting both apoptotic and autophagic machineries

, , , &
Pages 697-713 | Received 06 Sep 2012, Accepted 11 Feb 2013, Published online: 27 Feb 2013

Figures & data

Figure 1. Comparative effect of silibinin on viability of human CRC cells. (A) Effect of mitogens on silibinin-induced cell death in different human CRC cells under serum-starved (SS) conditions. (B) Effect of silibinin on viability, apoptotic death, cell cycle distribution and clonogenic potential of SW480 cells cultured under serum conditions. (C) Representative photomicrographs of SW480 cells cultured under different serum conditions, depicting intense cytoplasmic vacuolization due to silibinin treatment. All experimental procedures and statistical analysis were performed as detailed in Materials and Methods. #p < 0.01; *p < 0.001.
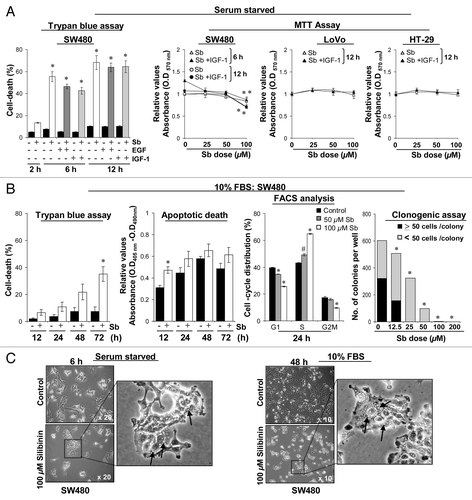
Figure 1. Comparative effect of silibinin on viability of human CRC cells. (A) Effect of mitogens on silibinin-induced cell death in different human CRC cells under serum-starved (SS) conditions. (B) Effect of silibinin on viability, apoptotic death, cell cycle distribution and clonogenic potential of SW480 cells cultured under serum conditions. (C) Representative photomicrographs of SW480 cells cultured under different serum conditions, depicting intense cytoplasmic vacuolization due to silibinin treatment. All experimental procedures and statistical analysis were performed as detailed in Materials and Methods. #p < 0.01; *p < 0.001.

Figure 2. Effect of silibinin on reactive oxygen species (ROS) generation in SW480 cells. (A and B) Time and dose-dependent effect of silibinin on intracellular superoxide radical generation and dissipation of mitochondrial potential (Δψm) as measured using dihydroethidium (DHE) and DiOC6(3) dyes, respectively. (B) Right panel, effect of cotreatment of antioxidants on ROS generation by silibinin. (C) Left panel, effect of cotreatment of antioxidants on apoptotic induction by silibinin; middle panel, effect of silibinin on expression levels of H2O2 quenching enzymes, CYCS release; right panel, mitochondrial network as traced by MitoTracker Red using confocal microscopy. All experimental procedures and statistical analysis were performed as detailed in Materials and Methods. *p < 0.001.
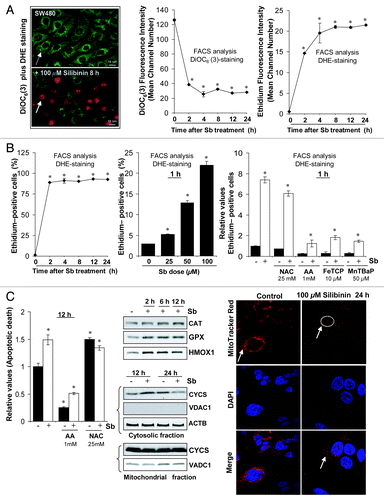
Figure 2. Effect of silibinin on reactive oxygen species (ROS) generation in SW480 cells. (A and B) Time and dose-dependent effect of silibinin on intracellular superoxide radical generation and dissipation of mitochondrial potential (Δψm) as measured using dihydroethidium (DHE) and DiOC6(3) dyes, respectively. (B) Right panel, effect of cotreatment of antioxidants on ROS generation by silibinin. (C) Left panel, effect of cotreatment of antioxidants on apoptotic induction by silibinin; middle panel, effect of silibinin on expression levels of H2O2 quenching enzymes, CYCS release; right panel, mitochondrial network as traced by MitoTracker Red using confocal microscopy. All experimental procedures and statistical analysis were performed as detailed in Materials and Methods. *p < 0.001.

Figure 3. Effect of silibinin on autophagy induction in SW480 cells. (A) Effect of silibinin on the expression levels of LC3-I, LC3-II and SQSTM1 levels, and the turnover of LC3-II after cotreatment with lysosomal inhibitors (E64d and pepstatin A). (B) Effect of silibinin on MDC incorporation and relative MDC fluorescence as detected by fluorescence photometry. (C) Effect of silibinin on SQSTM1 expression in CRC tumor xenografts in nude mice. Archival xenograft tissues of SW480 cells in athymic (nu/nu) nude male mice, as described in Materials and Methods were used in the present study. Representative DAB-stained tissue specimens from control and silibinin-fed groups are shown. Quantification of SQSTM1-positive cells represented as immunoreactivity score is shown as mean and ± SEM (error bars) of each group. Densitometric analysis of band intensity for SQSTM1 protein in immunoblots was adjusted with ACTB (blots not shown), and is shown as mean ± SEM (error bars) of the three bands from individual tumor tissue in each group. All experimental procedures and statistical analysis were performed as detailed in Materials and Methods. $p < 0.05; *p < 0.001.
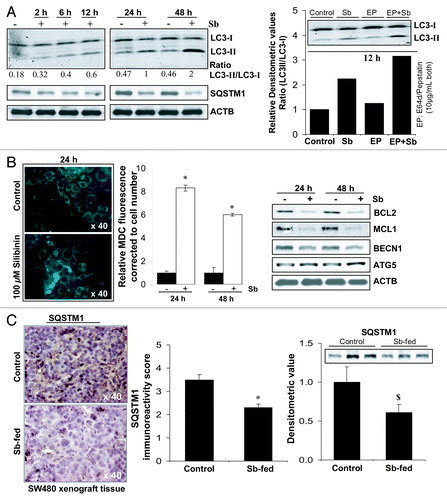
Figure 3. Effect of silibinin on autophagy induction in SW480 cells. (A) Effect of silibinin on the expression levels of LC3-I, LC3-II and SQSTM1 levels, and the turnover of LC3-II after cotreatment with lysosomal inhibitors (E64d and pepstatin A). (B) Effect of silibinin on MDC incorporation and relative MDC fluorescence as detected by fluorescence photometry. (C) Effect of silibinin on SQSTM1 expression in CRC tumor xenografts in nude mice. Archival xenograft tissues of SW480 cells in athymic (nu/nu) nude male mice, as described in Materials and Methods were used in the present study. Representative DAB-stained tissue specimens from control and silibinin-fed groups are shown. Quantification of SQSTM1-positive cells represented as immunoreactivity score is shown as mean and ± SEM (error bars) of each group. Densitometric analysis of band intensity for SQSTM1 protein in immunoblots was adjusted with ACTB (blots not shown), and is shown as mean ± SEM (error bars) of the three bands from individual tumor tissue in each group. All experimental procedures and statistical analysis were performed as detailed in Materials and Methods. $p < 0.05; *p < 0.001.

Figure 4. Visualization of autophagy induction and cellular morphology under transmission electron microscopy (EM) after treatment of SW480 cells with silibinin under serum-starved conditions. All experimental procedures and statistical analysis were performed as detailed in Materials and Methods. N, nucleus; C, cytoplasm; ER, endoplasmic reticulum with ribosomes as beads on membrane; M, mitochondria; AC, autophagic compartment; AP, autophagosomes.
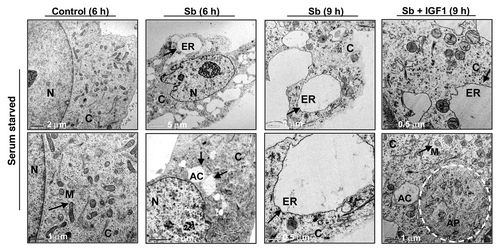
Figure 4. Visualization of autophagy induction and cellular morphology under transmission electron microscopy (EM) after treatment of SW480 cells with silibinin under serum-starved conditions. All experimental procedures and statistical analysis were performed as detailed in Materials and Methods. N, nucleus; C, cytoplasm; ER, endoplasmic reticulum with ribosomes as beads on membrane; M, mitochondria; AC, autophagic compartment; AP, autophagosomes.

Figure 5. Visualization of autophagy induction and cellular morphology under transmission electron microscopy (EM) after treatment of SW480 cells with silibinin alone or cotreatment with antioxidant AA, or autophagy inhibitors 3MA, and BAFA1 under serum conditions. All experimental procedures and statistical analysis were performed as detailed in Materials and Methods. N, nucleus; C, cytoplasm; ER, endoplasmic reticulum with ribosomes as beads on membrane; M, mitochondria; AC, autophagic compartment; DAC, electron dense autophagic compartment; AP, autophagosomes.
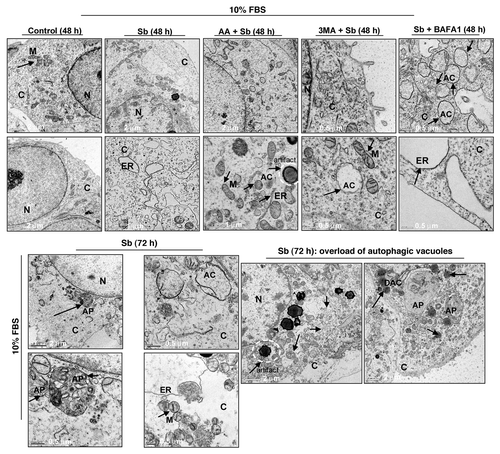
Figure 5. Visualization of autophagy induction and cellular morphology under transmission electron microscopy (EM) after treatment of SW480 cells with silibinin alone or cotreatment with antioxidant AA, or autophagy inhibitors 3MA, and BAFA1 under serum conditions. All experimental procedures and statistical analysis were performed as detailed in Materials and Methods. N, nucleus; C, cytoplasm; ER, endoplasmic reticulum with ribosomes as beads on membrane; M, mitochondria; AC, autophagic compartment; DAC, electron dense autophagic compartment; AP, autophagosomes.

Figure 6. Effect of silibinin on apoptotic induction in SW480 cells. (A) Effect of cotreatment with autophagy inhibitors BAFA1 and 3MA on apoptotic induction by silibinin in SW480 cells. (B) Effect of high dose (200 μM) silibinin on apoptotic induction in SW480 cells. All experimental procedures and statistical analysis were performed as detailed in Materials and Methods. *p < 0.001.
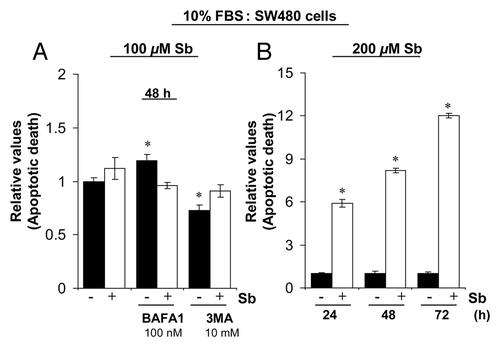
Figure 6. Effect of silibinin on apoptotic induction in SW480 cells. (A) Effect of cotreatment with autophagy inhibitors BAFA1 and 3MA on apoptotic induction by silibinin in SW480 cells. (B) Effect of high dose (200 μM) silibinin on apoptotic induction in SW480 cells. All experimental procedures and statistical analysis were performed as detailed in Materials and Methods. *p < 0.001.

Figure 7. Effect of silibinin on mitogen-induced cell signaling pathways. Effect of silibinin on (A) receptor tyrosine kinase (RTK’s) regulated activation of AKT and MAPK1/3 levels; (B) constitutively activated levels of AKT and MAPK1/3, under serum (left panel) and serum starved (middle panel) conditions, and kinase activity of MAPK1/3 and AKT (right panel). (C) Time-dependent effect of silibinin and antioxidants on MAPK1/3 activation under serum conditions. (D) Effect of MAP2K1/2 inhibitor (PD98059) and antioxidant NAC on silibinin-caused or EGF induced activation of MAPK1/3 levels under serum-starved conditions. All experimental procedures and data analysis were performed as detailed in Materials and Methods.
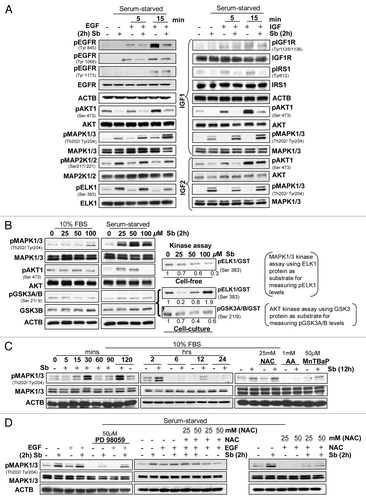
Figure 7. Effect of silibinin on mitogen-induced cell signaling pathways. Effect of silibinin on (A) receptor tyrosine kinase (RTK’s) regulated activation of AKT and MAPK1/3 levels; (B) constitutively activated levels of AKT and MAPK1/3, under serum (left panel) and serum starved (middle panel) conditions, and kinase activity of MAPK1/3 and AKT (right panel). (C) Time-dependent effect of silibinin and antioxidants on MAPK1/3 activation under serum conditions. (D) Effect of MAP2K1/2 inhibitor (PD98059) and antioxidant NAC on silibinin-caused or EGF induced activation of MAPK1/3 levels under serum-starved conditions. All experimental procedures and data analysis were performed as detailed in Materials and Methods.

Figure 8. Effect of silibinin treatment on cellular energy state in SW480 cells. Effect of silibinin on (A) activated PtdIns3K-AKT-MTOR pathway and (B) cap-dependent translation. (C) Effect of silibinin on activation of PRKAA2 due to altered AMP to ATP ratio. (D) Effect of silibinin on mitochondrial metabolism in SW480 cells by as early as 4 h: as indicated by the effect on high energy phosphates, de novo 13C TCA cycle production (including 13C-glutamate) and activation of glycolysis (de novo 13C-lactate) assessed by 31P- and 13C-NMR. All experimental procedures and data analysis were performed as detailed in Materials and Methods. *p < 0.05; **p < 0.03; ***p < 0.001.
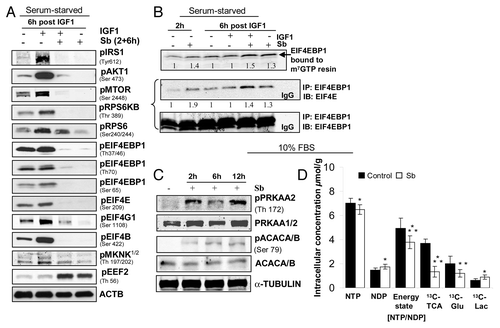
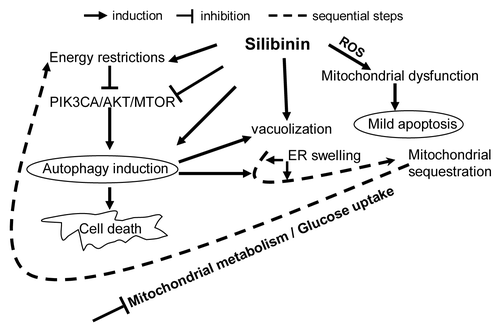
Figure 8. Effect of silibinin treatment on cellular energy state in SW480 cells. Effect of silibinin on (A) activated PtdIns3K-AKT-MTOR pathway and (B) cap-dependent translation. (C) Effect of silibinin on activation of PRKAA2 due to altered AMP to ATP ratio. (D) Effect of silibinin on mitochondrial metabolism in SW480 cells by as early as 4 h: as indicated by the effect on high energy phosphates, de novo 13C TCA cycle production (including 13C-glutamate) and activation of glycolysis (de novo 13C-lactate) assessed by 31P- and 13C-NMR. All experimental procedures and data analysis were performed as detailed in Materials and Methods. *p < 0.05; **p < 0.03; ***p < 0.001.

Table 1. Quantitative metabolic profile of untreated (control) and silibinin-treated (100 μM for 4 h) SW480 cells after incubation with [1-13C] glucose by high-resolution multinuclear NMR spectroscopya

Figure 9. Model depicting the possible molecular mechanisms of CRC cell death by silibinin.

Figure 9. Model depicting the possible molecular mechanisms of CRC cell death by silibinin.
Supplemental material

Additional material

Download Zip (143.9 KB)

Reprints and Corporate Permissions

Please note: Selecting permissions does not provide access to the full text of the article, please see our help page How do I view content?

To request a reprint or corporate permissions for this article, please click on the relevant link below:

Academic Permissions

Please note: Selecting permissions does not provide access to the full text of the article, please see our help page How do I view content?

Obtain permissions instantly via Rightslink by clicking on the button below:

If you are unable to obtain permissions via Rightslink, please complete and submit this Permissions form. For more information, please visit our Permissions help page.