Figures & data
Figure 1. CHDH is required for CCCP-induced and PARK2-mediated mitophagy. (A and B) HeLa-Control (Ctrl) and HeLa-CHDH knockdown (HeLa-shCHDH) stable cells were transfected with FLAG-Ctrl or FLAG-PARK2 and then exposed to DMSO or 10 μM CCCP for 24 h. After staining with TOMM20 antibody and Hoechst 33258 dye, cells were examined under a confocal microscope. Scale bar: 10 μm (A). Expression of CHDH in HeLa-Ctrl and HeLa-shCHDH cells was assessed using western blot analysis (B, upper). The signal intensity of TOMM20 in HeLa-Ctrl and HeLa-shCHDH cells (n > 50) exposed to CCCP and expressing PARK2 in (A) were quantified using the ImageJ program and are represented as bars with the mean ± SD, *P < 0.05 (B, lower). (C) HeLa-Ctrl and HeLa-shCHDH cells were transfected with PARK2 and Mito-RFP and treated with DMSO or 10 μM CCCP. After 24 h, cells were fixed and subjected to flow cytometry analysis, as described in Materials and Methods. (D and E) HeLa-Ctrl and HeLa-shCHDH cells were transfected with PARK2 and then left untreated or exposed to 10 μM CCCP for 24 h. Mitochondrial DNA and proteins were extracted and subjected to PCR analysis using synthetic primers for cytochrome b (MT-CYB) and ACTB (D), and western blot analysis using SOD2 and TOMM20 antibodies (E), respectively. (F and G) SN4741 cells were transiently transfected with Mito-RFP and either pSuper (Ctrl) or CHDH shRNA and then exposed to DMSO or 20 μM CCCP. After 24 h, cells were stained with Hoechst 33258 dye and examined under a confocal microscope. Scale bar: 10 μm (F). The signal intensities of Mito-RFP in CCCP-treated control and CHDH knockdown cells were quantified as in (B) and are represented as% of cells (n > 50) with cleared mitochondria. Bars represent the mean ± SD, *P < 0.001 (G). TUBA, tubulin, α.
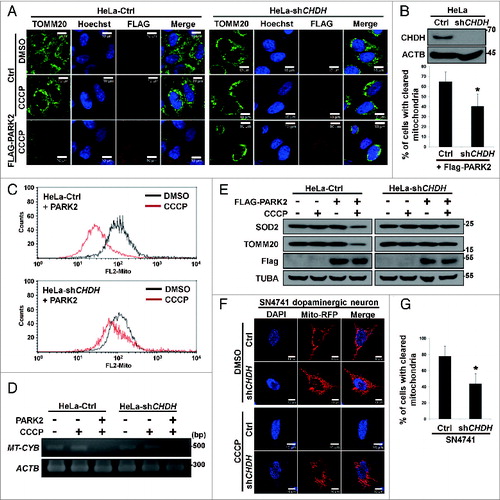
Figure 2. Overexpression of CHDH accelerates mitochondrial clearance independent of its enzymatic activity. (A) HeLa-Ctrl and HeLa-CHDH cells were cotransfected with GFP-LC3, Mito-RFP and either GFP control vector (Ctrl) or PARK2 and then incubated with 10 μM CCCP. After 2 h, cells were analyzed under a confocal microscope; the colocalization coefficient (%) of GFP-LC3 and Mito-RFP is shown with bars representing the mean ± SD, *P < 0.001. (B and C) HeLa-Ctrl and HeLa-CHDH cells were left untreated or exposed to 10 μM CCCP for 30 h (B) or for the indicated times (C). Mitochondrial DNA (MT-CYB) and proteins (CHDH, COX4I1) were extracted and analyzed by PCR (B) and western blotting (C), respectively. (D) HEK293T cells were cotransfected with Mito-GFP and pcDNA (Ctrl), CHDH + PARK2 or PINK1 + PARK2. Following treatment with DMSO or 100 μM CCCP for 2 h, the fluorescence of cells was measured, as described in Materials and Methods. The signal of Mito-GFP in control extracts is fixed as 100 and the relative ratio to the control is indicated as the mean ± SD, *P < 0.05. (E) Schematic of CHDH full-length (FL) and deletion mutants (FB1Δ, RDΔ, and FB2Δ). (F) The colocalization coefficient (%) of GFP-LC3 and Mito-RFP in the presence of CHDH-FL or deletion mutants was analyzed in the transfected cells under a confocal microscope and is represented as a bar graph with the mean ± SD. Cells were treated with 10 μM CCCP for 4 h. *P < 0.001. (G) HEK293T cells were transfected with CHDH or a series of deletion mutants and then subjected to LC-MS for measurement of enzyme activities, as described in Materials and Methods.
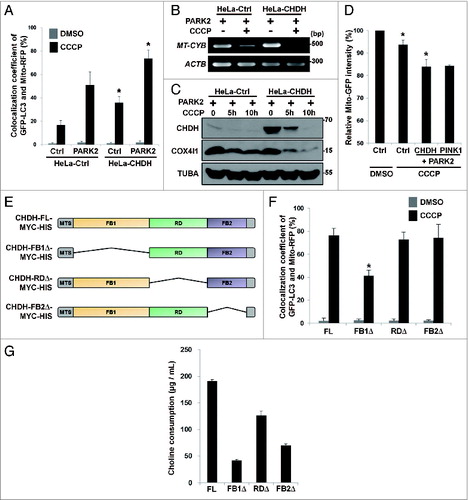
Figure 3. CHDH resides on the IM and OM of mitochondria and is enriched in the OM following CCCP treatment. (A) HEK293T cells were subjected to submitochondrial fractionation analysis, as described in Materials and Methods, and the fractions were verified using western blot analysis using the indicated antibodies. (B) Mitochondria isolated from HeLa and HEK293T cells were treated with the increasing concentrations (0.25, 0.5, 0.75, 1, and 2 μg/mL) of proteinase K, and the reaction products were analyzed with western blotting. (C–E) Following treatment of HEK293T cells with 0.1 μM CCCP for 30 min, mitochondria were purified and treated with Proteinase K (1 μg/mL), and the reaction products were analyzed using western blotting (C). HEK293T cells were pretreated with cycloheximide (CHX, 20 μg/mL) for 3 h and then exposed to 0.1 μM CCCP for 30 min, followed by submitochondrial fractionation and western blot analysis (D). The normalized relative ratio of CHDH signals detected in the OM and IM fractions on the blots in the (D) control group was determined by densitometric analysis using the ImageJ program (E). (F) HeLa cells were left untreated (Ctrl) or transfected with HA-CHDH-MYC-HIS. After permeabilization with 0.001% digitonin or 0.05% Triton X-100, cells were coimmunostained with TOMM20 (mouse/red) and SOD2 (rabbit/green) antibodies to confirm partial permeabilization (Ctrl) or with HA (mouse/red) and HIS (rabbit/green) antibodies (HA-CHDH-MYC-HIS) and then visualized under a confocal microscope. TUBA, tubulin, α. Scale bar: 10 μm
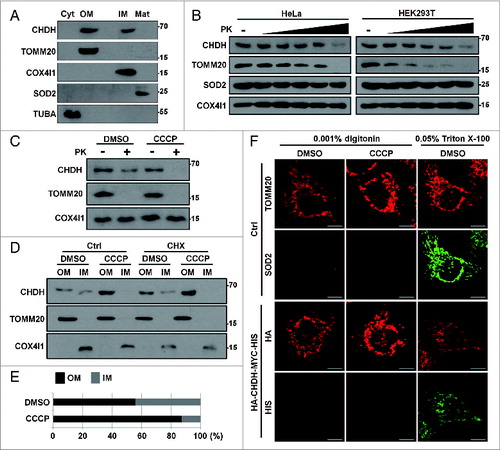
Figure 4. For figure legend, see page 1913.Figure 4 (See previous page). CHDH binds to SQSTM1, which requires the CHDH FB1 and SQSTM1 PB1 domains. (A) HEK293T cells were transfected with pcDNA (Ctrl) or HA-CHDH and then left untreated or treated with 10 μM CCCP for 30 min. Cell extracts were prepared and subjected to immunoprecipitation (IP) analysis using a CHDH antibody. The immunoprecipitates and whole cell lysates (WCL) were analyzed by western blotting. (B and C) SH-SY5Y cells were treated with 20 μM CCCP for the indicated times (B) or for 30 min (C). Cell extracts were subjected to immunoprecipitation (IP) analysis using preimmune normal (Nor) and CHDH antibody (B) or SQSTM1 antibody (C). TOMM20, COX4I1, and SOD2 were used as negative controls in western blotting (B). (D) HeLa-Ctrl and HeLa-shCHDH cells were transfected with FLAG-Ctrl or FLAG-PARK2 and then left untreated or exposed to 20 μM CCCP for 30 min. Cell extracts were subjected to immunoprecipitation (IP) analysis using a CHDH antibody. The asterisk indicates a heavy chain that is weakly bound across species. (E) HeLa cells were transfected with HA-VDAC1, CHDH and either control vector or PARK2 as indicated, and then treated with 10 μM CCCP for 3 h in the presence or absence of 5 μM MG132 or 20 nM bafilomycin A1 (Baf). (F) A schematic representation of SQSTM1 full-length (FL) and the PB1-deletion mutant (PB1Δ). (G and H) HEK293T cells were transfected with SQSTM1-FL-MYC-HIS or SQSTM1-PB1Δ-MYC-HIS and then treated with 20 μM CCCP for 30 min, after which cell lysates were subjected to immunoprecipitation (IP) analysis using CHDH antibody (G, upper) or MYC antibody (H, upper). The immunoprecipitates and whole cell lysates (WCL) were analyzed by western blotting (lower). (I) HEK293T cells were transfected with CHDH-MYC and its deletion mutants and then treated with 10 μM CCCP for 30 min, after which cell lysates were subjected to IP analysis using a MYC antibody.
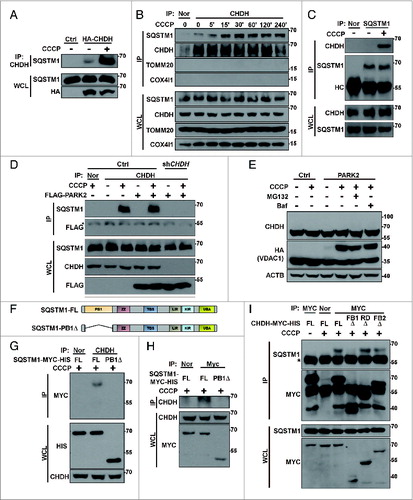
Figure 5. CHDH recruits SQSTM1 onto mitochondria during mitophagy. (A and B) HeLa-Ctrl and HeLa-shCHDH cells were transfected with Mito-RFP and FLAG-PARK2 and treated with 10 μM CCCP for 4 h. Following immunostaining with a SQSTM1 antibody, cells were examined under a confocal microscope (A) and the colocalization coefficient (%) of SQSTM1 and Mito-RFP was determined. Bars represent the mean ± SD, *P < 0.0001 (B). (C) SH-SY5Y-Ctrl and SH-SY5Y-shCHDH stable cells were treated with 20 μM CCCP for the indicated times and mitochondria were purified and analyzed by western blotting using the indicated antibodies. (D) HEK293T cells were transfected with CHDH-FL or CHDH-FB1Δ and then treated with 10 μM CCCP for the indicated times. Cell extracts were fractionated to isolate mitochondria followed by western blot analysis.
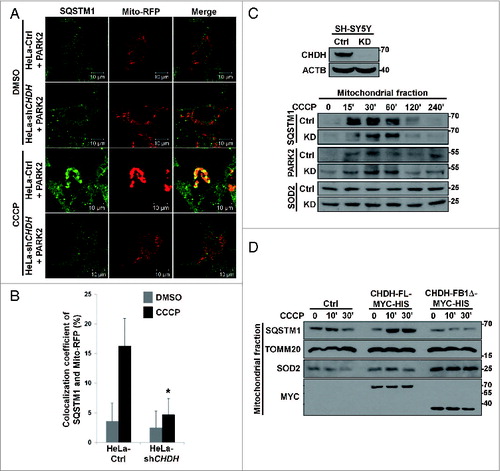
Figure 6. Interaction of CHDH with SQSTM1 increases the recruitment of LC3 into mitochondria to process mitophagy. (A) HeLa-Ctrl and HeLa-shCHDH cells were cotransfected with GFP-LC3, Mito-RFP, and either control vector (Ctrl) or PARK2. Following treatment with DMSO or 10 μM CCCP for 4 h, cells were fixed and observed under a confocal microscope. The colocalization coefficient (%) of GFP-LC3 and Mito-RFP was determined and bars represent the mean ± SD, *P < 0.005. (B) After HeLa cells were transfected with CHDH-FL-MYC-HIS or CHDH-FB1Δ-MYC-HIS and treated with 10 μM CCCP for 30 min, samples were subjected to an immunoprecipitation (IP) assay using preimmune (Nor) or a MYC antibody. The asterisk indicates the heavy chain of the MYC antibody. (C) sqstm1 KO MEF cells were exposed to 10 μM CCCP for 30 min. Cell extracts were subjected to an immunoprecipitation (IP) assay using a CHDH antibody and the immunoprecipitates and whole cell lysates (WCL) were analyzed by western blot. (D) HeLa cells were cotransfected with PARK2-GFP and either CHDH or CHDH-FB1Δ, treated with 10 μM CCCP for 24 h and then immunostained with a TOMM20 antibody. The percentage of cells showing reduced immunoreactivity against TOMM20 was determined using a confocal microscope and is represented as bars ± SD, *P < 0.001.
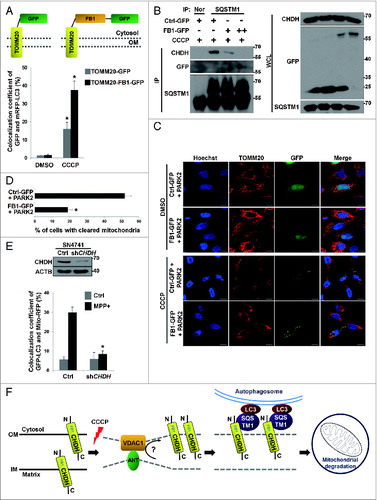
Figure 7. For figure legend, see page 1917.Figure 7 (See previous page). Inhibition of the interaction between CHDH and SQSTM1 hampers mitochondrial degradation. (A) Schematic diagram of TOMM20-FB1-GFP chimera (upper). HeLa cells were transfected with mRFP-LC3 and either TOMM20-GFP or TOMM20-FB1-GFP and exposed to 10 μM CCCP for 1 h. Cells were analyzed under a confocal microscope and the colocalization coefficient was determined. Bars represent the mean ± SD, *P < 0.0001 (lower). (B) HEK293T cells were transfected with different concentrations of GFP (Ctrl-GFP) or FB1-GFP (+: 2 μg, ++: 5 μg) and then treated with 10 μM CCCP for 30 min. Cell lysates were analyzed by immunoprecipitation (IP) and western blotting. (C and D) HeLa cells were transfected with PARK2 and either Ctrl-GFP or FB1-GFP. Following 24 h treatment with 10 μM CCCP, cells were subjected to immunocytochemical analysis using the indicated antibodies and then visualized under a confocal microscope. Scale bar: 10 μm. Statistical values for (C) are represented as bars with the mean ± SD, *P < 0.05 (D). (E) Stable SN4741-Ctrl or SN4741-shCHDH cells were transfected with GFP-LC3 and Mito-RFP and then treated with 100 μM MPP+ for 4 h. Cells were examined under a confocal microscope. The expression level of CHDH was determined using western blot analysis (upper) and the colocalization coefficient (%) between GFP-LC3 and Mito-RFP was determined (lower). Bars represent the mean ± SD, *P < 0.0001. (F) Proposed role of CHDH in mitophagy. CHDH resides on both the OM and IM of mitochondria and exposes its FB1 domain-containing N terminus to the cytosol on the OM. Following mitochondrial depolarization, CHDH accumulates on the OM probably through VDAC1 and interacts with SQSTM1 to recruit LC3 to the damaged mitochondria for mitophagy.