Figures & data
Figure 1. Peli3 knockdown inhibits LPS-dependent proinflammatory cytokine expression. RAW264.7 cells (A, C, and E) and BMDMΦ (G and H) stably transduced with shPeli3 or shctrl and J774A.1 cells (B, D, and F) transiently transfected with siPeli3 or sictrl were incubated with LPS for 6 h or remained as controls. (A and B) Functional Peli3 knockdown was determined on protein level by western blot analysis. (B) PRO-IL1B protein expression in Peli3-deficient J774A.1 cells was analyzed. RNA was isolated and mRNA expression of Peli3 (C, D, and G) and Il1b (E, F, and H) were analyzed using qPCR. mRNA levels were normalized to Tbp mRNA levels. Data represent the mean ± SEM of at least 3 individual experiments (*P < 0.05; **P < 0.01 vs. stimulated shctrl or sictrl).
Figure 2. LPS stimulation induces PELI3 binding to the autophagy adaptor protein SQSTM1. (A and B) RAW264.7 cells stably overexpressing FLAG-tagged PELI3 were stimulated with LPS for 3 h and 6 h or remained untreated as control. After cell lysis IP of FLAG-tagged PELI3 (A) was performed with FLAG-antibody and Dynabeads® and for SQSTM1-IP (B) Dynabeads® were coupled with SQSTM1-antibody. (A) SQSTM1 to FLAG-PELI3 IP-interaction (SQSTM1/FLAG) is shown in the densitometric quantification, representing the mean ± SEM of at least 3 individual experiments (*P < 0.05 vs. unstimulated sample). (C and D) Immunofluorescence analysis of PELI3 colocalization with autophagy markers. RAW264.7 cells overexpressing FLAG-tagged PELI3 were subjected to 6 h LPS treatment, fixed and stained with an anti-FLAG antibody and antibodies against endogenous MAP1LC3B (C) and SQSTM1 (D), respectively. Nuclei were counterstained by Hoechst 33342. Representative images of at least 3 individual experiments are shown. Arrows indicate colocalization of FLAG-tagged PELI3 and MAP1LC3B or SQSTM1. Scale bars: 5 μm. (D) Colocalization of FLAG-PELI3 with SQSTM1 is quantified by the Pearsons correlation coefficient (FLAG/SQSTM1) and represents the mean ± SEM of at least 3 individual experiments (***P < 0.001 vs. unstimulated sample).
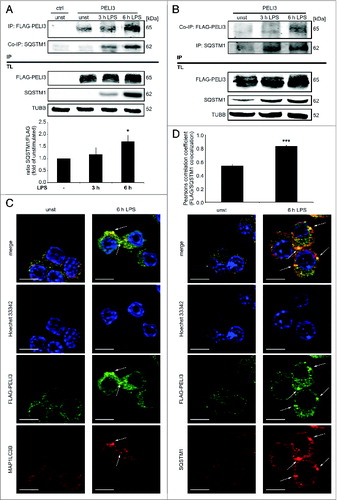
Figure 3 (See previous page). Autophagy inhibition stabilizes PELI3 protein. (A) RAW264.7 cells were treated with LPS for 6 h in combination with the lysosomal V-ATPase inhibitor bafilomycin A1 (Baf A1), the proteasomal inhibitor MG-132 or DMSO as a control. Protein abundance of SQSTM1, PELI3 and MAP1LC3B was analyzed by western blot. Densitometric quantification of PELI3 is shown and represents the mean ± SEM of at least 3 individual experiments (*P < 0.05; ***P < 0.001 vs. corresponding control). (B) RAW264.7 cells were treated with LPS for 6 h in combination with the specific proteasomal inhibitor epoxomicin (Epoxo) or DMSO as a control. Densitometric quantification of PELI3 protein level is shown and represents the mean ± SEM of at least 3 individual experiments (fold of 6 h LPS + DMSO). (C) PELI3 protein expression was analyzed by western blot in RAW264.7 cells treated with LPS and the autophagy inhibitor wortmannin (Wortm) or DMSO control. Densitometric quantification is provided and represents the mean ± SEM of at least 3 individual experiments (*P < 0.05 vs. DMSO + 6 h LPS). (D) Immunofluorescence staining of endogenous MAP1LC3B and overexpressed FLAG-tagged PELI3 in RAW264.7 cells was determined for unstimulated as well as LPS plus DMSO and Baf A1 treatments, respectively, as described before. Nuclei were counterstained by Hoechst 33342. Representative images of at least 3 individual experiments are shown. Arrows indicate colocalization of FLAG-tagged PELI3 and MAP1LC3B. Scale bars: 5 μm. RAW264.7 cells were transiently transfected with sictrl or 2 siRNA targeting Sqstm1 (E) or Atg7 (F) prior to LPS or mock treatment. Analysis of PELI3 and the correspondent siRNA target at protein levels.
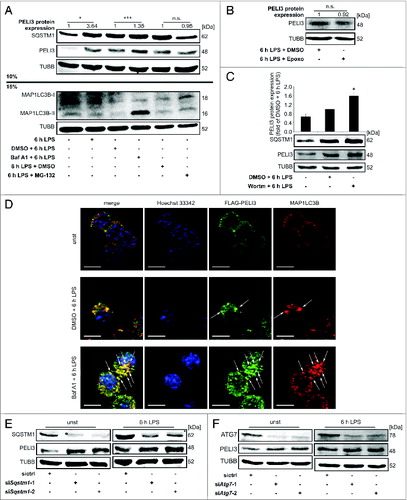
Figure 4 (See previous page). Autophagy destabilizes PELI3 protein. (A–D) RAW264.7 cells were incubated with LPS for 6 h or remained untreated as controls. In addition, cells were stimulated with distinct inducers of autophagy. (A) Lysates of cells treated with Torin2 were analyzed for the protein levels of PELI3 and SQSTM1. Densitometric quantification of PELI3 represents the mean ± SEM of at least 3 individual experiments (**P < 0.01 vs. DMSO + 6 h LPS). (B) Autophagy induction with Rapamycin (Rapa) was performed and cell lysates were analyzed for the protein expression of PELI3 and SQSTM1. Densitometric quantification of PELI3 represents the mean ± SEM of at least 3 individual experiments (*P < 0.05 vs. DMSO + 6 h LPS). (C) RAW264.7 cells were starved for 1 and 3 h with HBSS and protein expression of PELI3 and SQSTM1 was analyzed by western blot analysis. The graph shows the densitometric analysis of PELI3 and represents the mean ± SEM of at least 3 individual experiments (*P < 0.05 vs. corresponding (corr) HBSS control M). (D) The lysosomal marker LAMP2 and overexpressed FLAG-tagged PELI3 were stained for immunofluorescence as before. Representative images of at least 3 individual experiments are shown. Arrows indicate colocalization of FLAG-tagged PELI3 and LAMP2. Scale bars: 5 μm. LPS-dependent PELI3 stability was examined by western blot in RAW264.7 cells treated with cycloheximide (CHX) at 5 h after LPS stimulation alone (E) and combined with chemicals altering autophagy (F–H). (F) PELI3 protein level was checked for autophagy activation by Torin2 additional to CHX stimulation. (G) A further control experiment consisted of a neutralization mix of Torin2 and Wortm in addition to CHX treatment at 5 h after LPS treatment. (H) Supplemental stimulation of Torin2 combined with proteasomeal inhibition by Epoxo was added together with CHX. All parts (E–H) are illustrated in densitometric quantifications of PELI3 and represent the mean ± SEM of at least 3 individual experiments (**P < 0.01; ***P < 0.001 vs. LPS w/o CHX).
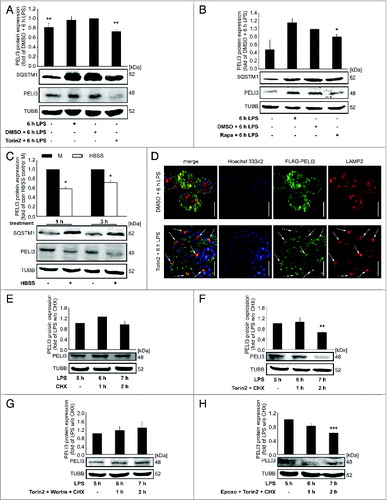
Figure 5. Autophagy attenuates PELI3-dependent PRO-IL1B expression. (A) RNA of Torin2-treated cells was isolated and mRNA expression of Il1b was analyzed using qPCR. mRNA levels were normalized to Tbp mRNA levels. DMSO plus LPS-treated sample is set as 1. Data represent the mean ± SEM of at least 3 individual experiments (**P < 0.01 vs. DMSO + 6 h LPS). (B) RNA of HBSS-starved cells was isolated and mRNA expression of Il1b was analyzed using qPCR. The mRNA levels were normalized to Tbp mRNA levels. Corresponding HBSS control M is set as 1. Data represent the mean ± SEM of at least 3 individual experiments (*P < 0.05 vs. corresponding (corr) HBSS control M). (C) J774A.1 cells transiently transfected with siPeli3 or sictrl were incubated with DMSO plus 6 h LPS, Torin2 plus 6 h LPS or remained as control. Protein abundance of PELI3 and PRO-IL1B were examined by western analysis. The graph shows the densitometric analysis of PRO-IL1B and represents the mean ± SEM of at least 3 independent experiments. sictrl with DMSO plus LPS-treated sample is set as 1 (**P < 0.01; ***P < 0.001 vs. sictrl and DMSO + 6 h LPS).
Figure 6 (See previous page). Lys316 contributes to Torin2-dependent PELI3 degradation. (A) Pull down assays in WT PELI3 overexpressing RAW264.7 cells were performed under denaturing conditions to detect ubiquitin conjugates on PELI3 after 6 h LPS or mock stimulation. Generation of RAW264.7 cells (B, C, and E) and J774A.1 cells (D and F) stably overexpressing either FLAG-tagged WT PELI3 or FLAG-tagged PELI3 mutant variants (K23R, K43R, K222R, K279R and K316R). These cells were stimulated with LPS for 6 h in combination with Torin2. To display the rescue effect of lysine replacement constructs, WT PELI3 was treated additionally with DMSO as control. (B) Western blot analysis of FLAG-tagged PELI3 in RAW264.7 cells was performed. The graph shows the densitometric analysis and represents the mean ± SEM of at least 3 individual experiments. Torin2 plus LPS-treated sample is set as 1 (*P < 0.05; **P < 0.01 vs. WT and Torin2 + 6 h LPS). (C) Western analysis of PRO-IL1β in RAW264.7 cells with a stable overexpression of FLAG-tagged WT PELI3 and the 3 shortlisted lysine-arginine replacement constructs (K43R, K279R and K316R). (D) Besides analysis of FLAG-PELI3 protein expression in J774A.1 cells, western analysis of PRO-IL1β was performed. Densitometric quantification of FLAG-PELI3 is provided and represents the mean ± SEM of at least 3 individual experiments (*P < 0.05 vs. WT and Torin2 + 6 h LPS). (E and F) RNA was isolated and Il1b mRNA expression was analyzed using qPCR. The mRNA levels were normalized to Tbp mRNA levels. DMSO plus LPS-treated sample is set as 1. Data represent the mean ± SEM of at least 3 individual experiments (*P < 0.05; **P < 0.01; ***P < 0.001 vs. WT and DMSO + 6 h LPS).
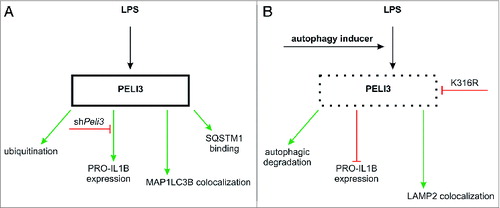
Figure 7. Proposed schema summarizing PELI3 regulation. (A) LPS treatment induces PELI3 protein expression as well as its subsequent ubiquitination, promotes binding to SQSTM1, and MAP1LC3B colocalization. Silencing Peli3 attenuates PRO-IL1B expression. (B) Autophagy activation degrades PELI3 protein as well as inhibits PRO-IL1B expression.