Figures & data
Figure 1. Vacuolin-1 inhibited the fusion between autophagosomes and lysosomes in HeLa cells. (A) Vacuolin-1 induced the accumulation of yellow LC3-II puncta in tfLC3B-expressing HeLa cells. Scale bar: 20 μM. Quantification of LC3 yellow puncta/red puncta (%) is expressed as mean ± S.E., n = ∼80 cells of 3 independent experiments. (B) Vacuolin-1 (1 μM) induced the accumulation of both LC3B-II and SQSTM1 in HeLa cells. (C) Vacuolin-1 (1 μM) markedly induced GFP-LC3B-II puncta in HeLa cells, which were not colocalized with RFP-LAMP1. Scale bar: 20 μM. The GFP-LC3B and LAMP1 colocalization coefficiency is expressed as mean ± S.E., n = ∼80 to 100 cells of 4 independent experiments. (D) Vacuolin-1 (1 μM) induced the accumulation of autophagic vacuoles as shown in the electron micrographs and highlighted in areas D1 and D2. Quantification of autophagosomes per cell are expressed as mean ± S.E., n = ∼20 to 40 cells. The *symbols indicate the results of the Student t test analysis, P < 0.05.
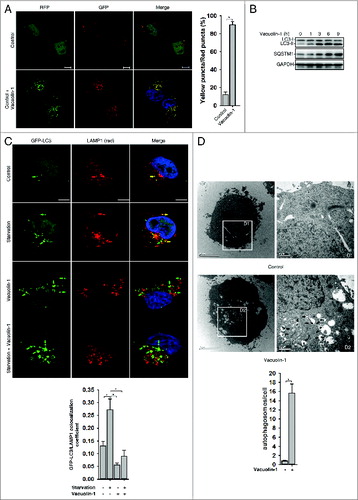
Figure 2. Vacuolin-1 reversibly inhibited autophagy by increasing lysosomal pH in HeLa cells. (A) Vacuolin-1 was a more potent autophagy inhibitor than CQ. Cells were treated with vacuolin-1 or CQ at the indicated dose for 6 h, and western blot analyses against LC3B and SQSTM1 were then performed. 100 μM CQ induced great cell loss is indicated by *. (B) Vacuolin-1 had much less cell toxicity than CQ in HeLa cells. Cells were treated with vacuolin-1 or CQ for the indicated doses for 48 h, and cell viability was then determined by MTT assay. (C) Vacuolin-1 (1 μM) reversibly inhibited autophagy. (D and E) Vacuolin-1 (1 μM) induced an increase of lysosomal pH in HeLa cells as determined by microplate reader measurement of Lysosensor DND-189 stained cells (D) or by a quantitative ratiometric LysoSensor Yellow/Blue DND-160 stained cells (E). (F) Vacuolin-1 (1 μM) pretreatment for 5 h markedly inhibited the ability of GPN (200 μM) to release lysosomal Ca2+ in Fura-2 loaded HeLa cells in the absence of extracellular Ca2+. The graphs in (B, D, E, or F) represent data from 3 independent experiments, and data are expressed as mean ± S.D., n = 3. The * symbols indicate the results of the Student t test analysis, P < 0.05.
Figure 3. Vacuolin-1 inhibited general endosomal-lysosomal degradation in HeLa cells. (A) The processing of CTSL from the precursor form to its mature form in HeLa cells treated with or without vacuolin-1 (1 μM) or BAF (100 nM). (B) Vacuolin-1 (1 μM) inhibited EGF-induced EGFR degradation in HeLa cells. (C) Vacuolin-1 (1 μM) inhibited the fusion of EGFR endosomes with lysosomes in HeLa cells. Scale bar: 20 μM. The EGF-488/LAMP1 colocalization coefficiency is expressed as mean ± S.E., n = ∼40 cells of 2 independent experiments. (D) Vacuolin-1 (1 μM) inhibited the degradation of DQ-BSA-Green in HeLa cells. (E) Vacuolin-1 nonspecifically inhibited V-ATPase as assessed by the in vitro V-ATPase assay, whereas BAF markedly inhibited it. The activity of V-ATPase (1.05 ± 0.09 μmol/min/mg) at 0 μM of inhibitors is set to 100%. The data are expressed as mean ± S.D., n = 3. The * symbols indicate the results of the Student t test analysis, P < 0.05.
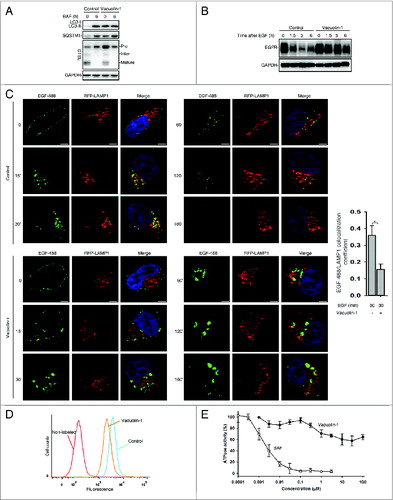
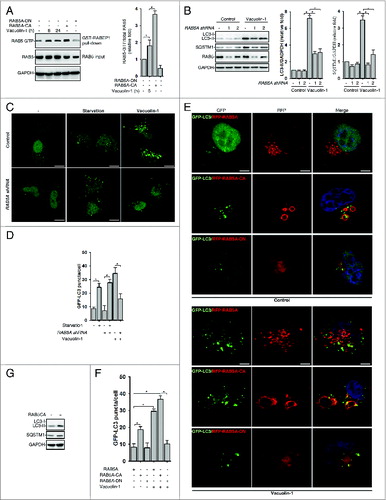
Figure 4. RAB5A is required for vacuolin-1-induced autophagy arrest and homotypic fusion in HeLa cells. (A) Vacuolin-1 (1 μM) activated RAB5A in HeLa cells. The active RAB5A in cells treated with vacuoin-1 or transfected with RAB5A-CA or RAB5A-DN were examined by a GST-tagged RABEP1 affinity isolation assay. Quantification of RAB5A-GTP/total RAB5A (relative fold) is expressed mean ± S.D., n = 3. (B) RAB5A knockdown blocked vacuolin-1-induced accumulation of LC3B-II and SQSTM1 in HeLa cells. Quantifications of LC3B-II/GAPDH and SQSTM1/GAPDH (relative fold) are expressed mean ± S.D., n = 4. (C) RAB5A knockdown blocked GFP-LC3 puncta induced by vacuolin-1 (1 μM) but not by starvation in HeLa cells. (D) Quantification of GFP-LC3B puncta/per cell in (C) is expressed as mean ± S.E., n = ∼50 to 60 cells of 3 independent experiments. The * symbols indicate the results of the Student t test analysis, P < 0.05. (E) Expression of RAB5A-CA enhanced vacuolin-1-induced autophagy arrest, whereas expression of RAB5A-DN blocked it in HeLa cells. (F) Data quantifications of GFP-LC3B puncta/per cell in (E) are expressed as mean ± S.E., n = ∼80 cells of 3 independent experiments. (G) Expression of RAB5A-CA alone induced the accumulation of LC3-II as assessed by western blot analyses (representative of 3 independent experiments).