Figures & data
Figure 1. Starvation-induced autophagy requires ATG4B. Saos-2 cell lines stably expressing GFP-LC3B were treated with lentiviral nonspecific “scrambled” shRNA (shCon) or ATG4B-directed shRNA (shATG4B). Stable lines expressing shCon-Saos (A and B) and shATG4B-Saos-2 (C and D) were incubated in medium enriched for amino acids and serum (A and C) or starved for amino acids and serum (B and D) for 4 h and GFP-LC3B visualized by fluorescence microscopy. GFP-LC3B labeled AVs were present in starved cells that contained ATG4B, but absent from cells lacking ATG4B. Scale bar (A–D): 10 μm. (E) Protein degradation in shCon-Saos-2 and shATG4B-Saos-2 cells was measured under fed and starved conditions as described in Materials and Methods. (F–H) shCon-Saos-2 and shATG4B-Saos-2 cells were incubated under fed and starved (G and H) conditions and the fractional volumes of AVs quantified from electron micrographs randomly selected from 3 independent experiments using morphometric methods described in Materials and Methods (F). Autophagic vacuoles (arrows) were identified by their pleomorphic structure and heterogeneous and/or CMPase (electron dense reaction product) content. The insets contain higher magnifications of representative AVs. Scale bar (G–H and insets): 1 μm. The values represent the mean ± SEM *P < 0.05; ***P < 0.001.
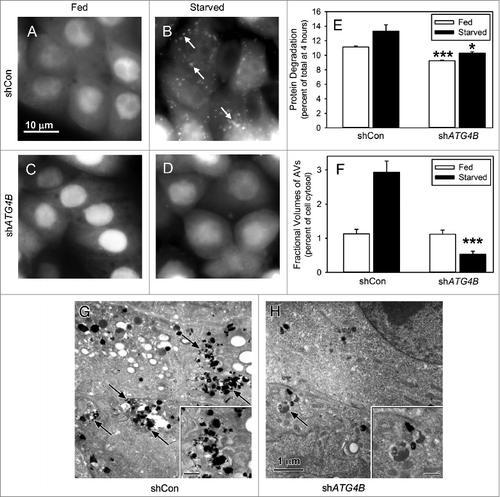
Figure 2. ATG4B is essential for cell survival under amino acid starved conditions and osteosarcoma tumor growth. (A) Saos-2, shCon-Saos-2, and shATG4B-Saos-2 cells were incubated in DMEM-based medium with or without amino acids. After 48 h, cell viability was quantified by MTT-based assays. The values represent the mean ± SEM (n = 8). ***P < 0.001 (B) Two groups of 5 immunodeficient nu/nu female mice were injected subcutaneously with 6 × 10⁶ shCon-Saos-2 or shATG4B-Saos-2 cells and the tumor dimensions measure over time. The volumes (cm3) represent the mean ± SEM (n = 5). The statistical difference is based on the data points that generated the trend line. *P < 0.05.
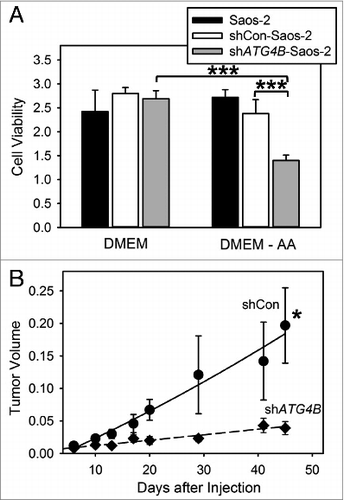
Figure 3. ATG4B-targeted compounds inhibit starvation-induced autophagy in Saos-2 cells. Saos-2 cells stably expressing GFP-LC3B were incubated under fed and starved conditions or under starvation conditions (St) in the presence of ATG4B-targeted compounds. After 4 h, the cells were fixed and the GFP-LC3B labeled AVs visualized by fluorescence microscopy (arrows). Fed Saos-2 cells sustained in nutrient-rich medium contained few AVs (A). Nutrient-starved cells contained numerous AVs (B), that were absent when treated with NSC185058 (C) or NSC377071 (D). Scale bar (A–D): 10 μm. (E) NSC185058 and NSC377071 inhibited autophagy in a dose response fashion. (F to I) Saos-2 cells were incubated under fed (G) or starved conditions (H) or starved conditions with NSC185058 (I) or NSC377071 (image not shown). At 4 h, the cells were fixed, processed for CMPase cytochemistry, and AVs (arrows) visualized by electron microscopy. The insets contain higher magnifications of representative AVs. Scale bar (G–I and insets H and I): 1 μm. (F) The fractional volume of AVs was quantified using morphometric methods described in Materials and Methods. The values represent the mean ± SEM (n = 3). ***P < 0.001.
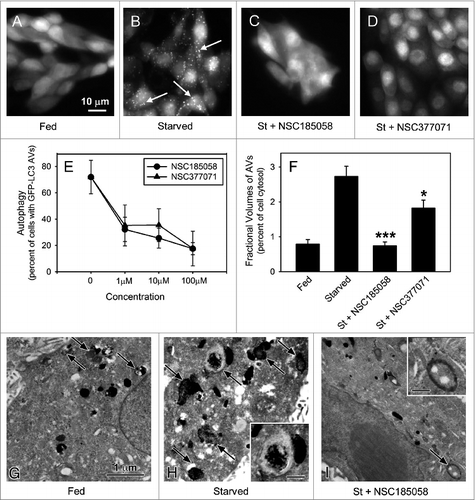
Figure 4. NSC185058 effectively inhibits ATG4B activity and LC3B lipidation. (A) Saos-2 (GFP-LC3B) cells were incubated under fed and starved conditions in the presence of 3-MA (10 mM), NSC185058 (100 μM), or NSC377071 (100 μM) for 2, 4, or 6 h. Nonlipidated (GFP-LC3B-I) and lipidated (GFP-LC3B-II) forms of GFP-LC3B were separated by SDS-PAGE and identified by western blotting using anti-GFP (Sigma) antibodies. The band density was quantified and the ratios calculated. (B) The cleavage of LC3B-GST by purified ATG4B was assayed as described in Materials and Methods. (C) The concentration-dependent effect of NSC185058 on ATG4B activity as shown in panel B was quantified. The densities of the LC3B-GST, GST and LC3B bands were measured. The fraction of (GST+LC3B)/(LC3B-GST+GST+LC3B) at each time point is calculated, which correlated with the fraction of products (Fp). Using Fp at time zero (Fp-0) as the baseline, the inhibition% at each time point is calculated as [1-(Fp-t/Fp-0)] × 100%.
![Figure 4. NSC185058 effectively inhibits ATG4B activity and LC3B lipidation. (A) Saos-2 (GFP-LC3B) cells were incubated under fed and starved conditions in the presence of 3-MA (10 mM), NSC185058 (100 μM), or NSC377071 (100 μM) for 2, 4, or 6 h. Nonlipidated (GFP-LC3B-I) and lipidated (GFP-LC3B-II) forms of GFP-LC3B were separated by SDS-PAGE and identified by western blotting using anti-GFP (Sigma) antibodies. The band density was quantified and the ratios calculated. (B) The cleavage of LC3B-GST by purified ATG4B was assayed as described in Materials and Methods. (C) The concentration-dependent effect of NSC185058 on ATG4B activity as shown in panel B was quantified. The densities of the LC3B-GST, GST and LC3B bands were measured. The fraction of (GST+LC3B)/(LC3B-GST+GST+LC3B) at each time point is calculated, which correlated with the fraction of products (Fp). Using Fp at time zero (Fp-0) as the baseline, the inhibition% at each time point is calculated as [1-(Fp-t/Fp-0)] × 100%.](/cms/asset/260c8d5f-188c-4894-843a-2a18c63654e9/kaup_a_973741_f0004_b.gif)
Figure 5. NSC185058 effectively inhibited ATG4 activity in cells. 293T (A) and HuH7 (B) cells transiently expressing ACTB-dNGLUC or ACTB-LC3B-dNGLUC were incubated in the presence of amino acids and serum. ATG4B was activated by rapamycin (Rap) or amino acid starvation (St) and the proteolytic cleavage of ACTB-LC3B-dNGLUC by ATG4B quantified by measuring dNGLUC (R.L.U.) recovered in the medium.30 The values represent the mean ± SEM (n = 3). Statistical comparisons were made to rapamycin treatment in (A) and to starvation conditions in (B) (**P < 0.01).
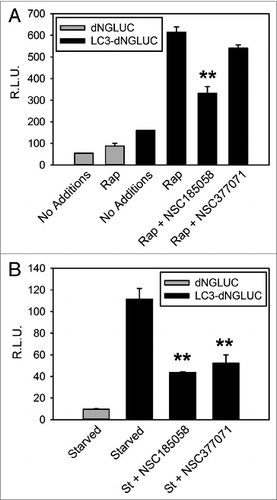
Figure 6. Effects of NSC185058 and NSC377071 on MTOR and PtdIns3K activities. (A) Saos-2 cells were incubated under fed (lane a), starved (lane b), fed plus rapamycin (lane c), fed plus rapamycin (Rap) in the presence of NSC185058, NSC377071, and NSC310664 (lanes d to f), and starved conditions (St) in the presence of 3MA (lane g) and NSC185058, NSC377072, and NSC310664 (lanes h to j). After 4 h, the cells were solubilized, proteins separated by SDS-PAGE and transferred to PVDF membranes, and the levels of ribosomal RPS6 and phosphorylated RPS6 (p-RPS6) evaluated on western blots. (B–G) Saos-2 (B, C, E, and F), shCon-Saos-2 (D) and shATG4B-Saos-2 (G) cell lines transiently expressing FYVE-RFP were incubated under fed (B), starved (C, D, and G), and starved conditions in the presence of NSC185058 (E) or NSC377071 (F). After 4 h, the cells were fixed and the FYVE-RFP labeled vacuoles (arrows) visualized by fluorescence microscopy. Scale bar (B–G): 10 μm.
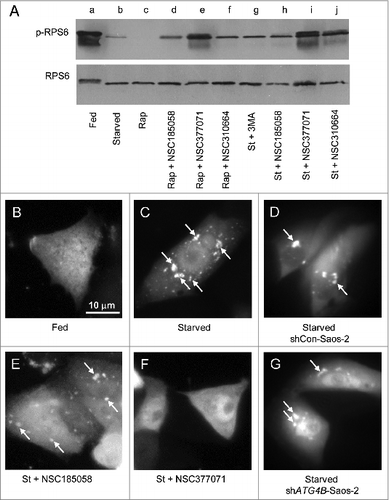
Figure 7. NSC185058 and NSC377071 inhibit starvation-induced autophagy in vivo. C57BL/6 mice were injected IP with adenoviral GFP-LC3B (Welgen, Inc., Worcester, MA) in order to transiently express the autophagy marker in the liver. At 2 24 h intervals, the mice were injected IP with peanut oil vehicle or antiautophagy compounds (100 mg/kg mouse weight) and the GFP-LC3B dots quantified. (A) The punctate appearance of GFP-LC3B labeled AVs (arrows) in livers from fasted untreated mice suggests ongoing autophagy. (B and C) The absence of AVs in NSC185058 or NSC377071-treated mice reveals that these compounds suppressed autophagy. Scale bar (A–C): 50 μm. (D) Quantification of the GFP-LC3B dots revealed that both NSC185058 and NSC377071 significantly inhibited starvation-induced (St) autophagy (***P < 0.001). The values represent the mean ± SEM, n = 4 to 6 trials.
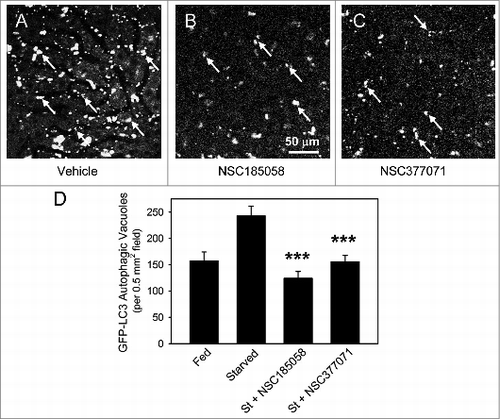
Figure 8. Osteosarcoma tumors treated with ATG4B antagonist NSC185058 fail to grow. (A) Saos-2 cells were incubated in nutrient-rich (closed circles) or amino acid-deprived (open triangles) medium in the presence of NSC185058 (3 to 200 μM). After 48 h, cell viability was quantified by MTT-based assays. The values represent the mean ± SEM (n = 6). The statistical differences between comparable concentrations of NSC185058 are indicated. ***P < 0.001 (B) Immunodeficient nu/nu female mice were injected subcutaneously with 6 × 10⁶ Saos-2 (GFP-LC3B) cells. At 7 d, the mice were divided into 2 groups of 5 mice each and injected IP on Monday, Wednesday, and Friday with either peanut oil vehicle or NSC185058 (100 mg/kg body weight) in peanut oil. This is a dosage that we have shown is sufficient to suppress liver autophagy in the mouse. The values represent the mean ± SEM (n = 4) of tumor volumes (cm3). (C) A second set of immunodeficient nu/nu female mice was injected subcutaneously with 6 × 10⁶ Saos-2 (GFP-LC3B) cells. Palpable tumors were detected at 12 d, and the mice were divided into 2 groups and injected IP on Monday, Wednesday, and Friday with either peanut oil vehicle (n = 8) or NSC185058 (100 mg/kg body weight) dissolved in peanut oil (n = 9). At 45 d, a crossover was done. The vehicle treated group was subjected to NSC185058 (open diamonds), while the NSC185058 treated group was switched to vehicle alone (open circles). NSC185058 significantly inhibited tumor growth, but the changes in tumor size after crossover failed to reach statistical significance. The values represent the mean ± SEM (n = 8 to 10) of tumor volumes (cm3 × 10−1). The statistical differences between comparable time points are indicated. *P < 0.05; **P < 0.01; ***P < 0.001
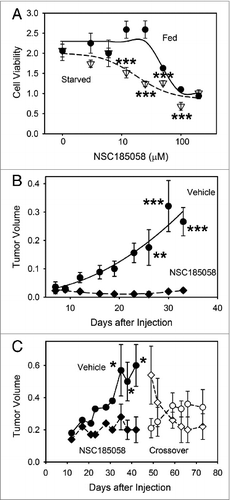
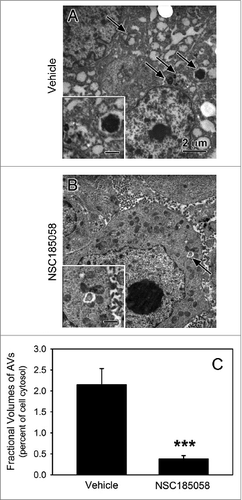
Figure 9. ATG4B antagonist NSC185058 inhibits autophagy within the osteosarcoma tumor. Immunodeficient nu/nu female mice were injected subcutaneously with Saos-2 cells. At 7 d, the mice were divided into 2 groups and injected IP on Monday, Wednesday, and Friday with either peanut oil (A) or NSC185058 (100 mg/kg body weight) in peanut oil (B). At the end time point, tumors were removed and then fixed and processed for electron microscopy (A and B). Pleomorphic AVs (arrows) were evident in the osteosarcomas from vehicle-treated mice, but relatively absent in the tumors from the NSC185058-treated mice. The insets contain higher magnifications of the representative AVs. The fractional volumes of the AVs were quantified by morphometrics as described in Materials and Methods (C). The values represent the mean ± SEM of 8 to 12 electron micrographs from each of 3 vehicle-treated and 4 NSC185058-treated tumors (***P < 0.001). Scale bar: 2 μm.