Figures & data
Figure 1. Connection between autophagy and the intracellular redox state in Saccharomyces. Analysis by western-blot of GFP-Atg8 cleavage assay in wild-type (WT) yeast cells growing exponentially in SD and treated with 0.5 mM H2O2 for 4 h (A) or 200 nM rapamycin for 2 h (D). Thirty micrograms of total extracts from untreated or treated cells were resolved by 12% SDS-PAGE followed by western blotting with anti-GFP and anti-Pgk1. The GFP-Atg8 fusion or free GFP proteins are marked with arrowheads. (B and E) Cells described in (A and D), respectively, were collected and processed for fluorescence microscopy analysis. The signal corresponds to GFP-Atg8. (C and F) Total gluthatione levels were measured in cells treated as described in (A and D), respectively. The data are represented as mean ± standard deviation from 5 independent experiments. “**,” Differences were significant at P < 0.01 according to the Student t test between untreated (control) and H2O2-treated cells (C), and between untreated (control) and rapamycin-treated cells (F).
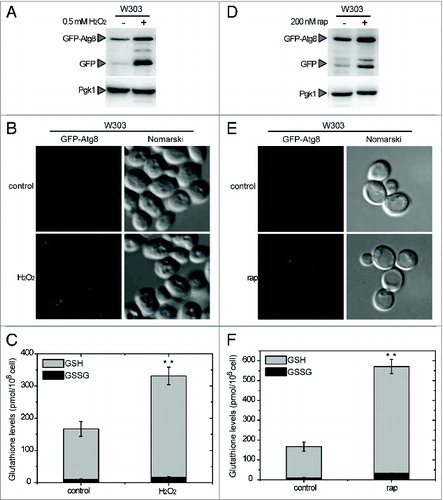
Figure 2. Atg4 is activated by reduction and reversibly inhibited by oxidation. Atg4 (4.5 μM) activity was monitored by following the cleavage of Atg8 (5 μM) from the unprocessed (Atg8) to the processed (pAtg8) form (indicated by arrowheads) by SDS-PAGE and Coomassie brilliant blue staining. (A) Effect of DTT on Atg4 activity. Atg4 was incubated for 2 h in the presence of DTT concentrations ranging from 10 μM to 5 mM. (B) Effect of H2O2 on the activity of prereduced Atg4. After pretreatment with 0.1 mM DTT for 1 h, Atg4 was incubated in the presence of increasing H2O2 concentrations for 2 h. Quantification of Atg4 activity from (A and B) is shown in (C and D), respectively. The reference sample for quantification (Atg4 activity = 1 in arbitrary units) was 5 mM DTT and 0 mM H2O2 (prereduced with DTT) in (A and B), respectively. (E) Inhibition of Atg4 activity by H2O2 is reversed by DTT. Atg4 protein was pretreated with 1 mM DTT for 2 h (lane 2); then, Atg4 was incubated with 2 mM H2O2 for 30 min (lane 3); finally, Atg4 was newly treated with 10 mM DTT for 30 min (lane 4). Control (lane 1): incubation with no addition. For all lanes, Atg8 was added to the reaction mixture for 1 h after each specific treatment to assess Atg4 activity.
Figure 3. Atg4 activity is dependent on the redox potential. Atg4 activity was monitored as in . (A) Atg4 activity is irreversibly inhibited by alkylating agents. Atg4 was pretreated with 1 mM DTT for 2 h (lane 1); then, incubated for 1 h with 10 mM iodoacetamide (IAM, lane 2) or 10 mM N-ethylmaleimide (NEM, lane 3); next, Atg4 was again incubated with 50 mM DTT for 30 min (lanes 4 and 5). (B) Atg4 activity is dependent on the DTTred/DTTox ratio. Atg4 activity was determined after incubation during 2 h in the presence of various DTTred/DTTox ratio (1/1, 1/10, 1/100, 10/1, 100/1 in mM). (C) Atg4 is not activated by GSH. Atg4 activity was analyzed after incubation for 2 h in the presence of 1 mM DTT (lane 2), 2 mM GSH (lane 3) or 5 mM GSH (lane 4), or in the absence of reducing agent (lane 1). (D) Redox titration of Atg4 activity. Atg4 activity was determined after incubation for 2 h at indicated Eh poised by 20 mM DTT in various dithiol/disulfide ratios. C: control untreated. The −∞ sample was used as reference for quantification. (E) Atg4 activities monitored as in (D) were interpolated by nonlinear regression of the data using a Nernst equation for 2 electrons exchanged (n = 2) and one redox component. The average midpoint redox potential (Em,7) of 4 independent experiments is reported in the figure as mean ± standard deviation.
Figure 4. Activation of Atg4 by thioredoxin. Atg4 activity was monitored as in . (A) Atg4 activity was measured after incubation for 1 h in the presence (+) or absence (−) of 25 μM DTT, 5 μM Trx1 and 5 μM Trx1C33S as indicated. (B) Quantification of Atg4 activity analyzed as in (A). The data are represented as mean ± standard deviation (n = 3). “**,” Differences were significant at P < 0.01 according to the Student t test between DTT and Trx1 samples, and between Trx1 and Trx1C33S samples. (C) Kinetics of Atg4 activation in the presence of diverse reductants as indicated using the same concentrations as in (A); control, no electron donor was added. (D) Quantification of Atg4 activity analyzed as in (C). The unprocessed (Atg8) and processed (pAtg8) forms of Atg8, Trx1 and monomeric and dimeric Trx1C33S are marked with arrowheads. The reference sample for quantification was Trx1+DTT and Trx1+DTT, 240 min in (B and D), respectively.
Figure 5. Autophagy activation in the trx1 trx2 mutant. Autophagy induction was analyzed in wild-type (W303 and SEY6210), trx1 trx2 mutant and atg4 mutant strains treated with 200 nM rapamycin for 2 h. (A) Thirty micrograms of total extracts from the different strains grown in SD in the absence (−) or presence (+) of rapamycin were resolved by 12% SDS-PAGE followed by western blotting with anti-GFP and anti-Pgk1. The GFP-Atg8 fusion or free GFP proteins are marked with arrowheads. (B) Quantification of the signal corresponding to free GFP from (A). The reference sample for quantification was W303 control. The data are represented as mean ± standard deviation (n = 4). “*,” Differences were significant at P < 0.05 according to the Student t test between W303-rap and trx1 trx2 mutant-rap or atg4 mutant-rap. (C) Control or rapamycin-treated W303 and trx1 trx2 mutant cells were collected and processed for fluorescence microscopy analysis. The signal corresponds to GFP-Atg8.
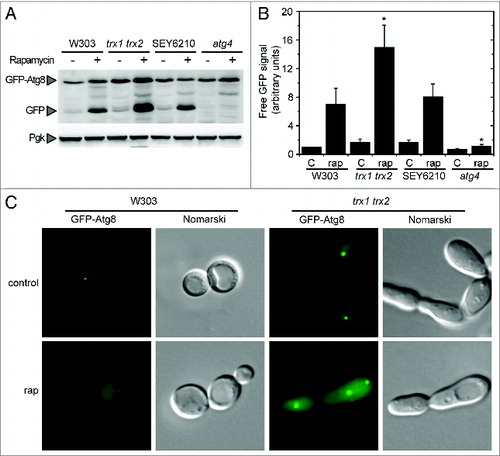
Figure 6. The Cys-to-Ser mutant proteins Atg4C338S and Atg4C394S are not redox-regulated. Atg4 activity was monitored as in . (A) The activity of Atg4 WT, Atg4C147S, Atg4C338S, or Atg4C394S was determined after incubation for 2 h in the presence (+) or absence (−) of 25 μM DTT and 5 μM Trx1 as indicated. (C) Same as in (A) but after incubation for 2 h in the presence of 5 mM GSH. (B) and (D) Quantification of Atg4 activity determined as in (A and C), respectively. The reference sample for quantification was WT-Trx1+DTT and Atg4C394S+GSH in (B and D), respectively. The data are represented as mean ± standard deviation (n = 3). “**,” Differences were significant at P < 0.01 according to the Student t test between the DTT-WT and DTT-C338S or DTT-C394S mutants. The Atg8 and pAtg8 forms, and Trx1 are marked with arrowheads.
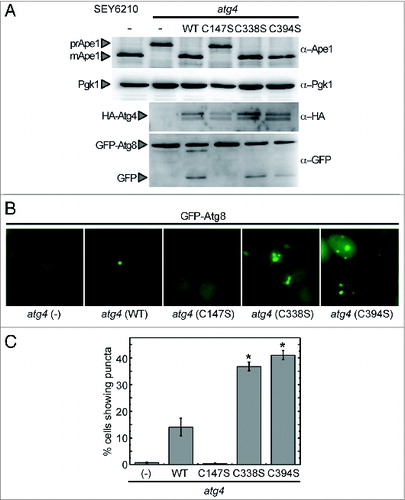
Figure 7. Complementation of an atg4 mutant strain with WT or mutant forms of Atg4. (A) atg4 mutant strain was transformed with empty vector (−) or a plasmid encoding Atg4 WT, Atg4C147S, Atg4C338S, or Atg4C394S, to express a HA-tagged version of the corresponding protein under the control of the ATG4 promoter. The wild-type strain (SEY6210) was used as a positive control. Thirty micrograms of total extracts from stationary phase cells grown in SD were resolved by 12% SDS-PAGE followed by western blotting with anti-Ape1, anti-Pgk1, anti-HA and anti-GFP. The precursor (prApe1) and mature (mApe1) forms of Ape1, Pgk1, HA-Atg4, GFP-Atg8 fusion or free GFP proteins are marked with arrowheads. (B) Cells growing exponentially in SD were collected and processed for fluorescence microscopy analysis. The signal corresponds to GFP-Atg8. (C) The percentage of cells from (B) displaying GFP-Atg8 puncta were quantified. The data are represented as mean ± standard deviation from 3 independent experiments. “*,” Differences were significant at P < 0.05 according to the Student t test between atg4 (WT) and atg4 (C338S) or atg4 (C394S). Number of cells quantified: n = 620 for atg4 (−), n = 700 for atg4 (WT), n = 600 for atg4 (C147S), n = 1275 for atg4 (C338S) and n = 1465 for atg4 (C394S).