Figures & data
Figure 1. Acute H2O2 treatment increases autophagy flux in the RPE. ARPE-19 (A, B, C, E) and hRPE (D) cells were subjected to sublethal levels of H2O2 (200 or 400 μM) for up to 24 h. (A) Protein carbonyl levels and (B) cell viability and mitochondrial respiration following exposure to H2O2. (C, D) Autophagic flux was monitored in the presence or absence of bafilomycin A1 (Baf A1; 75 nM) by LC3-II/-I conversion with anti-LC3 antibody. Anti-ACTB antibody was used as an internal control. A representative protein gel blot is shown together with densitometric quantification of the LC3-II/-I ratio from a mean of 3 experiments. Differences between groups were considered statistically significant when P < 0.05. (E) Autophagosome counts in ARPE-19 cells were obtained following immunostaining with LC3 antibody to identify autophagic puncta. A representative set of photomicrographs is shown for control cells and those exposed to H2O2. Autophagosome numbers were counted in a minimum of 3 experiments and statistical significance between the control group and each treatment group was determined by ANOVA. Differences between groups were considered statistically significant when P < 0.05.
Figure 2. The effect of H2O2 on the expression of the autophagy-related proteins BECN1, ATG7, and ATG9 in ARPE-19 cells was determined by western blot. ACTB was used as an internal control. A representative protein gel blot is shown together with densitometric quantification from a mean of 3 experiments. Differences between groups were considered statistically significant when P < 0.05.
Figure 3. Acute rotenone treatment increases autophagy flux in the RPE. ARPE-19 cells were exposed to 1 or 10 μM rotenone for 6 or 24 h. (A) Cell viability and mitochondrial respiration following exposure to rotenone. (B) Autophagic flux was monitored by LC3-II/-I conversion using western blot with anti-LC3 antibody. ACTB was used as an internal control. A representative protein gel blot is shown together with densitometric quantification of the LC3-II/-I ratio from a mean of 3 experiments. Differences between groups were considered statistically significant when P < 0.05. (C) Autophagosome counts in ARPE-19 cells exposed to 0, 1, or 10 uM rotenone for 24 h were obtained following immunostaining with LC3 antibody to identify autophagic puncta. Statistical significance between the control group and each treatment group was determined by ANOVA. (D) The effect of rotenone on the expression of the autophagy-related proteins BECN1, ATG7, and ATG9 was determined by western blot. ACTB was used as an internal control. A representative protein gel blot is shown together with densitometric quantification from a mean of 3 experiments. Differences between groups were considered statistically significant when P < 0.05.
Figure 4. Chronic exposure to hydrogen peroxide reduces autophagic response in the RPE. ARPE-19 (A–D, F) and hRPE cells (E) were treated with 200 or 400 μM H2O2 daily for 14 d. Control cells received vehicle alone. (A) Protein carbonyl levels and cell viability following exposure to H2O2. (B) Cell viability and mitochondrial respiration following exposure to H2O2. (C) Phase contrast images of ARPE-19 cells either untreated or exposed daily to H2O2. Scale bar: 100 μm. (D,E) Autophagic flux was monitored in the presence or absence of bafilomycin A1 (Baf A1; 75 nM) by LC3-II/-I conversion with anti-LC3 antibody. ACTB was used as an internal control. Representative western blots are shown together with densitometric quantification of the LC3-II/-I ratio from a mean of 3 experiments, Differences between groups were considered statistically significant when P < 0.05. (F) The effect of H2O2 on the expression of the autophagy-related proteins BECN1, ATG7, and ATG9 was determined by protein gel blot. ACTB was used as an internal control. A representative western blot is shown together with densitometric quantification from a mean of 3 experiments. Differences between groups were considered statistically significant when P < 0.05.
Figure 5. Reduced autophagy renders ARPE-19 cells more susceptible to oxidative stress while increased autophagy protects cells against oxidative stress. (A) Autophagosome counts in ARPE-19 cells treated for 12 h with 3-MA (10 mM) or rapamycin (100 nM) and treated with H2O2 (400 μM) for 3 h were obtained following immunostaining with LC3 antibody to identify autophagic puncta. (B) ARPE-19 cells were pretreated for 12 h with 3-MA (10 mM) or rapamycin (100 nM) and treated with H2O2 (400 μM) for 3 h after which mitochondrial respiratory activity was determined using the MTT assay. Differences between means were considered statistically significant from 4 independent experiments when P < 0.05 using one-way ANOVA. (C) The crystal violet assay was performed on 3-MA and rapamycin pretreated RPE cells and subsequently exposed to 0.8 and 1.5 mM H2O2. Differences between means were considered statistically significant from 4 independent experiments when P < 0.05 using one-way ANOVA. (D) BECN1 and ATG7 knockdown by lentiviral shRNAs in RPE was confirmed by protein gel blot. Knockdown was considered statistically significant when P < 0.01 from at least 3 independent experiments (E) The MTT assay was performed on ARPE-19 cells with BECN1 or ATG7 knockdown to assess the cell viability in response to increasing concentrations of H2O2. Differences between means were considered statistically significant from 4 independent experiments when P < 0.05 or 0.01 using one-way ANOVA.
Figure 6. The effect of oxidative stress on mitochondrial membrane potential and glutathione levels in ARPE-19 cells. (A) Cells were pretreated with rapamycin for 3 h and then exposed to H2O2 (200 and 400 μM) for 3 h. Cells were assessed for mitochondrial membrane potential using the JC-1 dye. (B, C) Cells were treated with rotenone (1 and 10 μM) for 24 h and mitochondrial membrane potential determined using the JC-1 dye. (B) Representative photomicrographs showing JCI staining. (C) Quantitation of JC-1 staining using a fluorometric plate reader. (D,E) Stable ATG7 knockdown and scrambled control ARPE-19 cells were treated with H2O2 for 24 h and assessed for mitochondrial membrane potential using JC-1 dye. (D) Representative photomicrographs showing JC-1 staining. (E) Quantification of JC-1 staining using a fluorometric plate reader. (F) Mitochondrial membrane potential was measured using JC-1 dye on cells treated for 14 d with H2O2 (200 and 400 μM). (G) ARPE-19 cells were incubated with H2O2 (200 μM) for 24 h and the intracellular GSH:GSSG ratio was determined by the glutathione assay kit. (H) Mitochondrial mass was compared following exposure to 200 μM H2O2 for 24 h in ARPE-19 cells either pretreated or not treated with rapamycin (100 nM) for 3 h. Data were analyzed using one-way ANOVA and differences between means were considered statistically significant when P < 0.05.
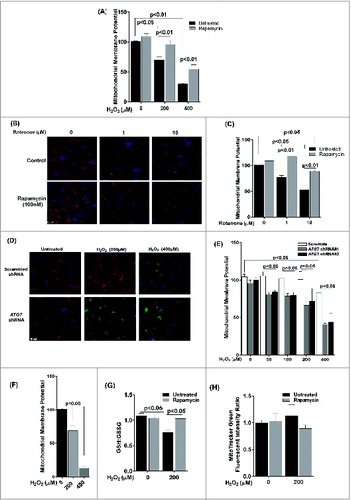
Figure 7. Decreased autophagy increases the generation of reactive oxygen species (ROS) and accumulation of lipofuscin-like granules in the RPE. After daily exposure of ARPE-19 cells to 200 μM H2O2 for 14 d 3-MA or rapamycin was added 12 h before assaying for: (A) ROS in RPE by the H2DCFDA assay, (B) mitochondria respiration using the MTT assay and (C) RPE cells maintained in basal medium with daily exposure to leupeptin (100 μM), rapamycin (50 nM), 3-MA (10 mM), or vehicle control for up to 14 d. The accumulation of autofluorescence granules was determined at 7 and 14 d by FACS analysis. (D) RPE cells were fed 2 × 10⁷ photoreceptor outer segments (POS)/ml daily either alone or in combination with 3-MA or rapamycin in basal media. Autofluorescent granule accumulation was determined at 7 and 14 d by FACS analysis. For each experiment, differences between means were considered statistically significant from 3 independent experiment when P < 0.05.
Figure 8. Expression of autophagy proteins and autophagosome volume in 2 rodent models of AMD. (A) Sod2 knockdown in C57BL6 mice was achieved with subretinal AAV1-Rz-SOD2 (AAV1 containing inactive ribozyme acted as a control). Animals were sacrificed at 1 mo and 3 mo (early AMD) and 6 mo (late AMD) following Sod2 knockdown (n = 6 per group). (A) Retinas were fixed in paraformaldehyde, paraffin embedded, and immunostained for LC3, ATG7 and ATG9 (red), and DAPI was used to visualize the nuclei (blue). Representative photomicrographs are shown for Sod2 knockdown and control animals. (B) APOE4 mice at the age of 15 mo were fed a high fat, cholesterol-enriched (HFC) diet for a period of 2 mo (n = 6 per group). Age-matched control APOE4s were maintained on a normal diet (ND). Retinas were fixed in paraformaldehyde, wax embedded and immunostained for LC3, ATG7, or ATG9 (red), and DAPI was used to visualize the nuclei (blue), Representative photomicrographs are shown for APOE4-HFC and APOE4-ND control animals. (C) Autophagosome fractional volume in the RPE of 6-mo- and 12-mo-old WT mice, Sod2 knockdown mice at 6 and 12 mo following Sod2 knockdown and APOE4 mice on normal (ND) and high fat cholesterol-enriched (HFC) diets (n = 6 per group). (D) Representative electron micrographs showing autophagosomes (arrows) in SOD2 knockdown and control animals. Scale bar: 1 μm. (E) RPE/choroid/sclera lysates from APOE4-HFC (black bars) and APOE4-ND (grey bars) mice (n = 6 per group) were assessed for the level of autophagic proteins by western blot and densitometric quantification. Expression was normalized to ACTB as internal control. Differences between means were considered statistically significant when P < 0.05.
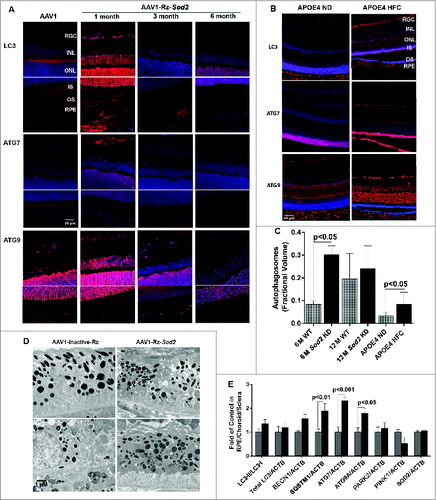
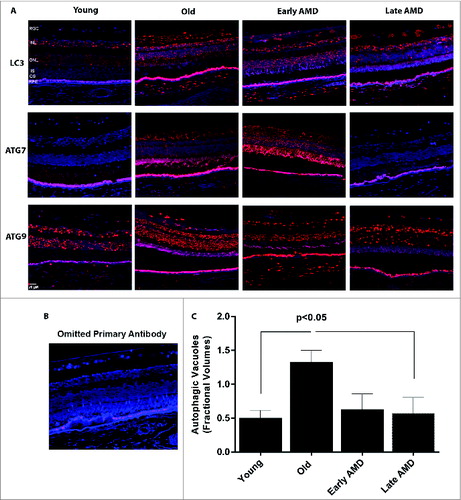
Figure 9. Expression of autophagy proteins and autophagosome volume in human retinas from normal and AMD donors. (A) Representative photomicrographs from human donor retinas from young, old, early AMD and late AMD. Retinas were fixed in paraformaldehyde, paraffin embedded, and immunostained for LC3, ATG7 or ATG9 (red), and DAPI was used to visualize the nuclei (blue). Each group had n = 4 specimens for analysis. (B) Omission of primary antibody. (C) Fractional volumes of autophagosomes in the RPE of human donor retinas from young, old, early AMD, and late AMD determined from electron micrographs (n = 5 per group), P < 0.05.