783
Views
8
CrossRef citations to date
0
Altmetric
Report

Processing and sustained in vitro release of rifampicin containing composites to enhance the treatment of osteomyelitis

, , , , , , & show all
Pages 213-225 | Published online: 01 Oct 2012

Figures & data

Figure 1. The cumulative (A) and daily (B) release of rifampicin (R) from composites of poly(L-lactide-co-ε-caprolactone) (PLCL) and β-tricalcium phosphate (TCP) with initial TCP contents of 0 wt%, 50 wt% and 60 wt% and rifampicin content of 8 wt%. Results shown as averages with standard deviations (n = 5).
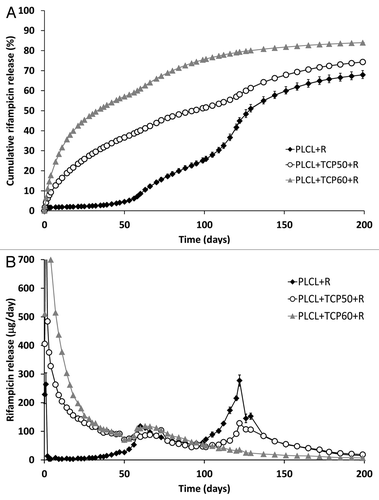
Figure 1. The cumulative (A) and daily (B) release of rifampicin (R) from composites of poly(L-lactide-co-ε-caprolactone) (PLCL) and β-tricalcium phosphate (TCP) with initial TCP contents of 0 wt%, 50 wt% and 60 wt% and rifampicin content of 8 wt%. Results shown as averages with standard deviations (n = 5).

Figure 2. Bioluminescence results of the rifampicin containing (8 wt%) composites of poly(L-lactide-co-ε-caprolactone) and 50 wt% of β-tricalcium phosphate on a bacterial culture of light emitting Pseudomonas aeruginosa. Pellets containing rifampicin are on the lower row and corresponding composites without rifampicin are on the top row and act as controls.
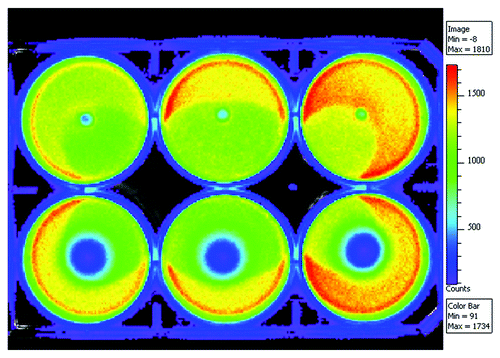
Figure 2. Bioluminescence results of the rifampicin containing (8 wt%) composites of poly(L-lactide-co-ε-caprolactone) and 50 wt% of β-tricalcium phosphate on a bacterial culture of light emitting Pseudomonas aeruginosa. Pellets containing rifampicin are on the lower row and corresponding composites without rifampicin are on the top row and act as controls.

Figure 3. Chemical structure, atom numbering and the 1H chemical shifts of rifampicin.

Figure 3. Chemical structure, atom numbering and the 1H chemical shifts of rifampicin.

Figure 4. Weight average molar weight (Mw) (A), and mass loss and water absorption (B) of the studied composites as a function of time in vitro. The composites comprised of poly(L-lactide-co-ε-caprolactone) (PLCL) and β-tricalcium phosphate (TCP) and rifampicin (R) with initial TCP contents of 0 wt%, 50 wt% and 60 wt% and rifampicin content of 8 wt%. Error bars in part B are not visible due to the small values of standard deviations.
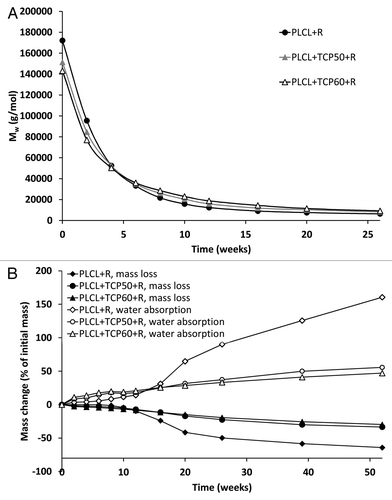
Figure 4. Weight average molar weight (Mw) (A), and mass loss and water absorption (B) of the studied composites as a function of time in vitro. The composites comprised of poly(L-lactide-co-ε-caprolactone) (PLCL) and β-tricalcium phosphate (TCP) and rifampicin (R) with initial TCP contents of 0 wt%, 50 wt% and 60 wt% and rifampicin content of 8 wt%. Error bars in part B are not visible due to the small values of standard deviations.

Figure 5. β-tricalcium phosphate (TCP) contents of the studied composites as a function of time in vitro. The composites comprised of poly(L-lactide-co-ε-caprolactone) (PLCL), TCP, and rifampicin (R) with initial TCP contents of 50 wt% (TCP50), and 60 wt% (TCP60) and rifampicin content of 8 wt%. Results shown as averages with standard deviations (n = 5).
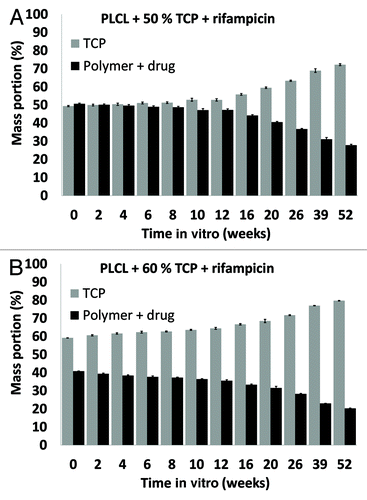
Figure 5. β-tricalcium phosphate (TCP) contents of the studied composites as a function of time in vitro. The composites comprised of poly(L-lactide-co-ε-caprolactone) (PLCL), TCP, and rifampicin (R) with initial TCP contents of 50 wt% (TCP50), and 60 wt% (TCP60) and rifampicin content of 8 wt%. Results shown as averages with standard deviations (n = 5).

Figure 6. Glass transition temperatures (Tg) (A) and melting enthalpies (ΔHf) (B) of the copolymer in the studied composites as a function of time in vitro. The composites comprised of poly(L-lactide-co-ε-caprolactone) (PLCL) and β-tricalcium phosphate (TCP) and rifampicin (R) with initial TCP contents of 0 wt%, 50 wt% and 60 wt%. Results shown as averages with standard deviations (n = 2–5).
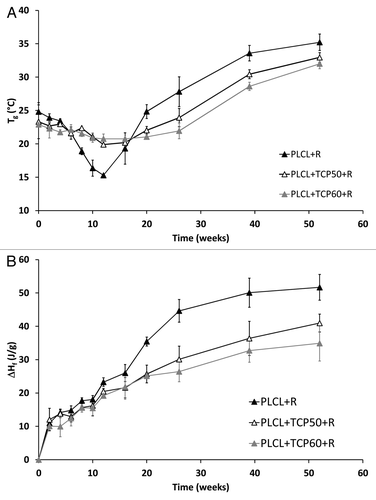
Figure 6. Glass transition temperatures (Tg) (A) and melting enthalpies (ΔHf) (B) of the copolymer in the studied composites as a function of time in vitro. The composites comprised of poly(L-lactide-co-ε-caprolactone) (PLCL) and β-tricalcium phosphate (TCP) and rifampicin (R) with initial TCP contents of 0 wt%, 50 wt% and 60 wt%. Results shown as averages with standard deviations (n = 2–5).

Figure 7. SEM micrographs of the composites of poly(L-lactide-co-ε-caprolactone) (PLCL), 60 wt% of β-tricalcium phosphate (TCP) and rifampicin. (A–C) fractured surfaces after 0 weeks, 26 weeks and 52 weeks in vitro respectively. (D–F) outer surfaces after 0 weeks, 26 weeks and 52 weeks in vitro respectively.
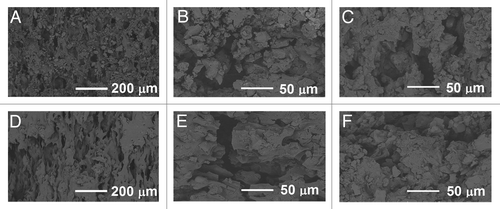
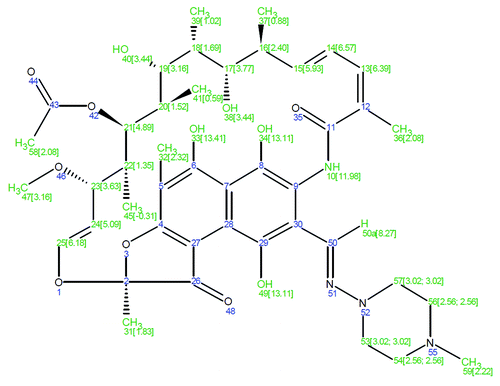
Figure 7. SEM micrographs of the composites of poly(L-lactide-co-ε-caprolactone) (PLCL), 60 wt% of β-tricalcium phosphate (TCP) and rifampicin. (A–C) fractured surfaces after 0 weeks, 26 weeks and 52 weeks in vitro respectively. (D–F) outer surfaces after 0 weeks, 26 weeks and 52 weeks in vitro respectively.