807
Views
9
CrossRef citations to date
0
Altmetric
Report

Design of 2D chitosan scaffolds via electrochemical structuring

, , , , , & show all
Article: e29506 | Received 05 Feb 2014, Accepted 05 Jun 2014, Published online: 18 Jun 2014

Figures & data

Table 1. Samples abbreviations

Figure 1. Optical microscope observation of aluminum grids 1000µm microchannels (A) and 500µm microchannels; optical and SEM observation of chitosan meshes 1000µm microchannels (C and E), 500µm microchannels (D and F), random porosity (G and H). Scale bar: optical microscope 2 mm, SEM 100 µm.
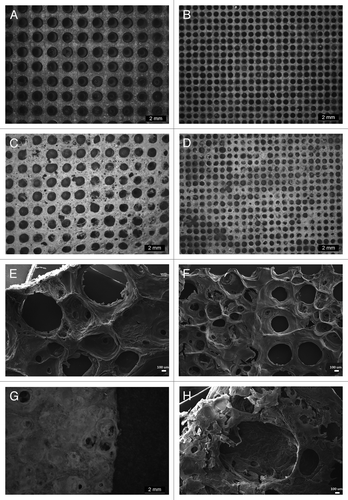
Figure 1. Optical microscope observation of aluminum grids 1000µm microchannels (A) and 500µm microchannels; optical and SEM observation of chitosan meshes 1000µm microchannels (C and E), 500µm microchannels (D and F), random porosity (G and H). Scale bar: optical microscope 2 mm, SEM 100 µm.

Figure 2. SEM images of Genipin (1) and Epichloroydrin (2) cross-linked meshes with different morphologies 1000µm microchannels (A), 500µm microchannels (B), random porosity (C). Scale bar 100 µm.
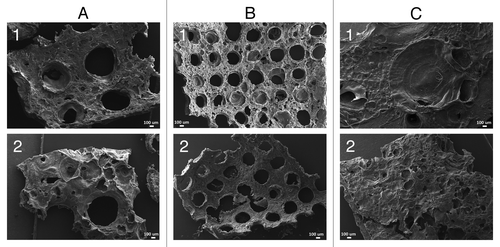
Figure 2. SEM images of Genipin (1) and Epichloroydrin (2) cross-linked meshes with different morphologies 1000µm microchannels (A), 500µm microchannels (B), random porosity (C). Scale bar 100 µm.

Figure 3. Swelling behavior of CS meshes at pH 7.4 (A–C) and at pH 5 (B–D), different morphologies (A–B), different cross-linker (C–D).
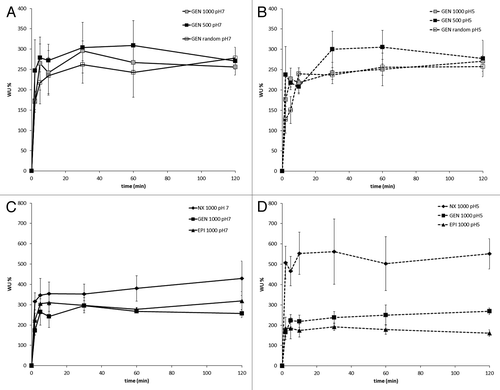
Figure 3. Swelling behavior of CS meshes at pH 7.4 (A–C) and at pH 5 (B–D), different morphologies (A–B), different cross-linker (C–D).

Table 2. Mechanical properties: elongation at break (ε [%]); Young modulus E (MPa). Statistical analysis show significant differences (P < 0.05 at t test) for: Young Modulus GEN1000 vs NX1000 and GEN500 vs NX500; ε at break GEN1000 vs NX1000 and GEN500 vs NX500

Figure 4. MTT assay of MS1 cells on the different substrata 24h (A) and 72h (B) after seeding.

Figure 4. MTT assay of MS1 cells on the different substrata 24h (A) and 72h (B) after seeding.

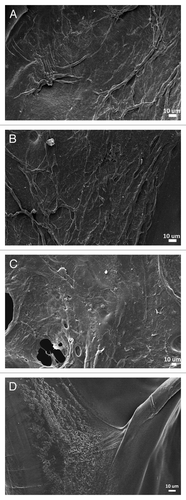
Figure 5. SEM images of MS1 cells cultured for 72h on different chitosan scaffolds: GEN1000 (A); EPI1000 (B); NX1000 (C); scaffolds without cells (D).

Figure 5. SEM images of MS1 cells cultured for 72h on different chitosan scaffolds: GEN1000 (A); EPI1000 (B); NX1000 (C); scaffolds without cells (D).