839
Views
19
CrossRef citations to date
0
Altmetric
Research Paper

Inactivation of Brca2 cooperates with Trp53R172H to induce invasive pancreatic ductal adenocarcinomas in mice

A mouse model of familial pancreatic cancer

, , , , , , , , , & show all
Pages 959-968 | Received 06 Jan 2011, Accepted 17 Mar 2011, Published online: 01 Jun 2011

Figures & data

Figure 1 Kaplan-Meier survival analysis of CB and CBP mice. Kaplan-Meier survival analysis of CB and CBP mice cohorts reveals a trend towards shorter survival in the latter, but it is not statistically significant.
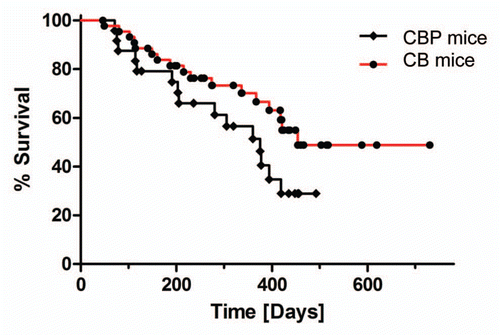
Figure 1 Kaplan-Meier survival analysis of CB and CBP mice. Kaplan-Meier survival analysis of CB and CBP mice cohorts reveals a trend towards shorter survival in the latter, but it is not statistically significant.

Figure 2 Histopathology of exocrine pancreatic insufficiency in CB and CBP mouse pancreata in the absence of invasive neoplasia. (A) Profound loss of exocrine pancreatic parenchyma in a CB mouse at 6 months age demonstrating extensive adipose (fatty) replacement and residual islets with minimal functioning exocrine tissue (H&E stain, 10× magnification). (B) Minimal residual exocrine parenchyma (acinar tissue) in a six month old CBP mouse (H&E stain, 20× magnification). (C) Degenerated cystic lesions observed in both CB and CBP mice, lined by flattened cuboidal epithelium and often containing hemorrhagic fluid (H&E stain, 20× magnification). (D) Strips of murine pancreatic intraepithelial neoplasia (mPanIN) are observed in a background of adipose (fatty) replacement and near total absence of viable acinar tissue in a 15-month-old CB mouse (H&E stain, 10× magnification).
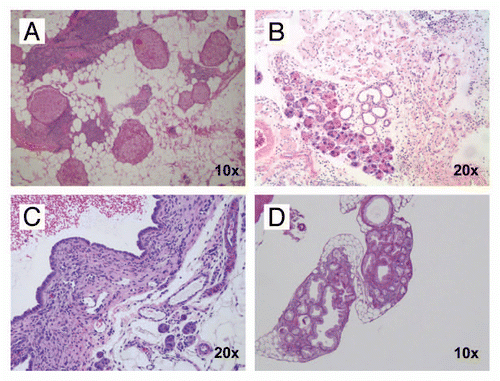
Figure 2 Histopathology of exocrine pancreatic insufficiency in CB and CBP mouse pancreata in the absence of invasive neoplasia. (A) Profound loss of exocrine pancreatic parenchyma in a CB mouse at 6 months age demonstrating extensive adipose (fatty) replacement and residual islets with minimal functioning exocrine tissue (H&E stain, 10× magnification). (B) Minimal residual exocrine parenchyma (acinar tissue) in a six month old CBP mouse (H&E stain, 20× magnification). (C) Degenerated cystic lesions observed in both CB and CBP mice, lined by flattened cuboidal epithelium and often containing hemorrhagic fluid (H&E stain, 20× magnification). (D) Strips of murine pancreatic intraepithelial neoplasia (mPanIN) are observed in a background of adipose (fatty) replacement and near total absence of viable acinar tissue in a 15-month-old CB mouse (H&E stain, 10× magnification).

Figure 3 Histopathology of non-invasive precursor lesions in CB mice. Examples of low-grade (A) and high-grade (B) mPanIN lesions arising in the pancreas of a CB mouse at 11 months of age. Several areas with acinar-to-ductal metaplasia were also found (C); higher magnification (D). (H&E stains). (E) CBP mice (red columns) have an earlier onset of mPanIN compared to CB mice (blue columns). By 10 months of age, both cohorts have comparable frequency of mPanIN lesions.
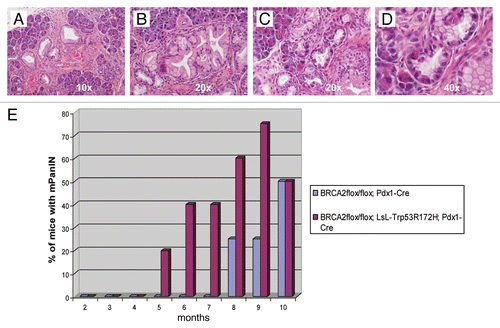
Figure 3 Histopathology of non-invasive precursor lesions in CB mice. Examples of low-grade (A) and high-grade (B) mPanIN lesions arising in the pancreas of a CB mouse at 11 months of age. Several areas with acinar-to-ductal metaplasia were also found (C); higher magnification (D). (H&E stains). (E) CBP mice (red columns) have an earlier onset of mPanIN compared to CB mice (blue columns). By 10 months of age, both cohorts have comparable frequency of mPanIN lesions.

Figure 4 Brca2 immunohistochemistry confirms loss of protein expression in lesional pancreatic epithelium. (A and B) Brca2 immunohistochemistry confirms robust cytoplasmic expression in granulosa cells of the ovary, a known positive control (10× and 40″ magnification). (C and D) Minimal to absent Brca2 expression is observed within the lining epithelium of the degenerated cysts, a prototype of which is illustrated in (10× and 40× magnification). Note that the subjacent mesenchymal cells retain Brca2 expression. (E and F) Minimal to absent Brca2 expression is observed within mPanIN lesions arising in a “CPB” mouse (10× and 40× magnification).
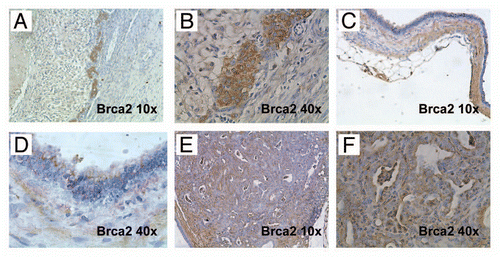
Figure 4 Brca2 immunohistochemistry confirms loss of protein expression in lesional pancreatic epithelium. (A and B) Brca2 immunohistochemistry confirms robust cytoplasmic expression in granulosa cells of the ovary, a known positive control (10× and 40″ magnification). (C and D) Minimal to absent Brca2 expression is observed within the lining epithelium of the degenerated cysts, a prototype of which is illustrated in Figure 2 (10× and 40× magnification). Note that the subjacent mesenchymal cells retain Brca2 expression. (E and F) Minimal to absent Brca2 expression is observed within mPanIN lesions arising in a “CPB” mouse (10× and 40× magnification).

Figure 5 A minority of CB mice develop invasive and metastatic PDAC at relatively long latency (15 months or greater). (A) Example of a metastatic PDAC arising in a 24-month-old CB mouse. Multiple metastatic lesions in liver and spleen are readily visible. (B) Serial transplantation of tumor tissue into athymic mice resulted in growth as subcutaneous xenografts, a property of cancer cells. (C) Histologically, the primary and metastatic tumors were comprised of moderately differentiated PDAC (H&E stain, 10× magnification). (D) Moderately differentiated PDAC, at a higher magnification (H&E stain, 20× magnification). Note mucin vacuoles within neoplastic glands.
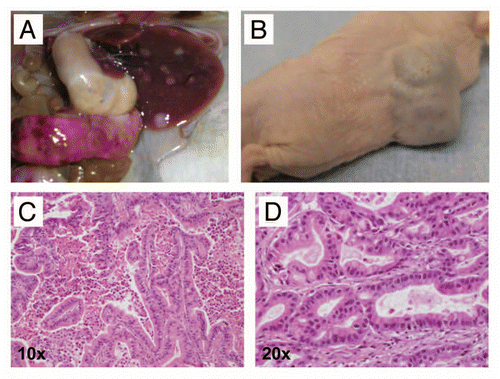
Figure 5 A minority of CB mice develop invasive and metastatic PDAC at relatively long latency (15 months or greater). (A) Example of a metastatic PDAC arising in a 24-month-old CB mouse. Multiple metastatic lesions in liver and spleen are readily visible. (B) Serial transplantation of tumor tissue into athymic mice resulted in growth as subcutaneous xenografts, a property of cancer cells. (C) Histologically, the primary and metastatic tumors were comprised of moderately differentiated PDAC (H&E stain, 10× magnification). (D) Moderately differentiated PDAC, at a higher magnification (H&E stain, 20× magnification). Note mucin vacuoles within neoplastic glands.

Figure 6 Macroscopic images of metastatic pancreatic cancers arising in CBP mice. (A) A primary pancreatic cancer (white dotted line) and numerous grossly visible metastatic lesions (white arrows) to distant organ sites, including peritoneum, diaphragm (B), lungs (C) and liver (D). At these advanced stages, malignant ascites was observed in some of the affected mice (E). In addition, some animals developed hemorrhagic intra-pancreatic cystic lesions, likely due to bleeding (F).
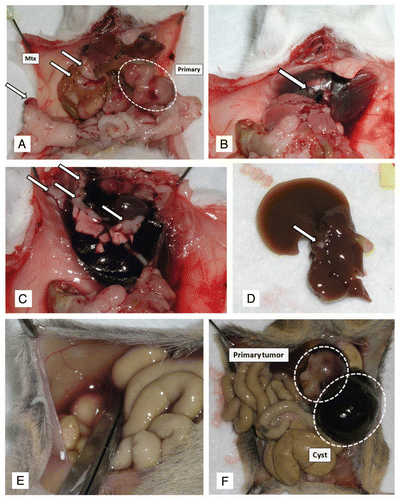
Figure 6 Macroscopic images of metastatic pancreatic cancers arising in CBP mice. (A) A primary pancreatic cancer (white dotted line) and numerous grossly visible metastatic lesions (white arrows) to distant organ sites, including peritoneum, diaphragm (B), lungs (C) and liver (D). At these advanced stages, malignant ascites was observed in some of the affected mice (E). In addition, some animals developed hemorrhagic intra-pancreatic cystic lesions, likely due to bleeding (F).

Figure 7 Variable histopathological features of PDAC arising in CBP mice. (A) Primary PDAC with extensive stromal desmoplasia, resembling the cognate human disease is observed in this CBP mouse (H&E stain, 2× magnification). (B) At higher magnification, infiltrating neoplastic glands in a bed of desmoplastic stroma can be seen (H&E stain, 20× magnification). (C) An example of a biphasic tumors with both adenocarcinoma and sarcomatoid components (H&E stain, 4× magnification). (D) At higher magnification of the tumor in (C), the confluence between the two components is highlighted (H&E stain, 20× magnification). (E) Higher magnification of the sarcomatoid carcinoma component also confirms the presence of atypical pleomorphic nuclei and mitotic figures (arrow) (H&E stain, 40× magnification). (F) An anaplastic carcinoma with prominent giant cells arising in a CBP mouse (H&E stain, 20× magnification).
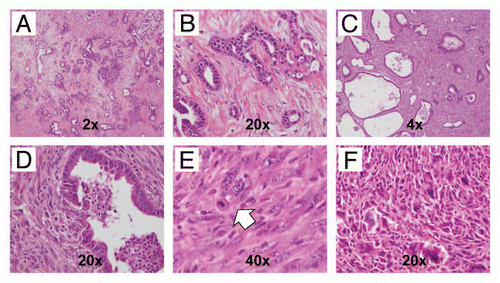
Figure 7 Variable histopathological features of PDAC arising in CBP mice. (A) Primary PDAC with extensive stromal desmoplasia, resembling the cognate human disease is observed in this CBP mouse (H&E stain, 2× magnification). (B) At higher magnification, infiltrating neoplastic glands in a bed of desmoplastic stroma can be seen (H&E stain, 20× magnification). (C) An example of a biphasic tumors with both adenocarcinoma and sarcomatoid components (H&E stain, 4× magnification). (D) At higher magnification of the tumor in (C), the confluence between the two components is highlighted (H&E stain, 20× magnification). (E) Higher magnification of the sarcomatoid carcinoma component also confirms the presence of atypical pleomorphic nuclei and mitotic figures (arrow) (H&E stain, 40× magnification). (F) An anaplastic carcinoma with prominent giant cells arising in a CBP mouse (H&E stain, 20× magnification).

Figure 8 Inactivation of Brca2 promotes DNA damage in the exocrine pancreas. (A) Immunohistochemical staining for pH2AXSer139 shows minimal labeling within acinar cells in pancreatic tissue sections derived from hemizygous Pdx1-Cre; Brca2flox/wt mice (negativ function in CB mice results in markedly increased pH2AXSer139 immunolabeling in pancreatic acinar cells (B and C), but not in the ductal epithelia (red arrows). Note robust expression of pH2AXSer139 in two highly atypical acinar cell nuclei (white arrowheads). (D) Marked upregulation of pH2AXSer139 labeling in the sarcomatoid carcinoma component of a PDAC arising in a CBP mouse.
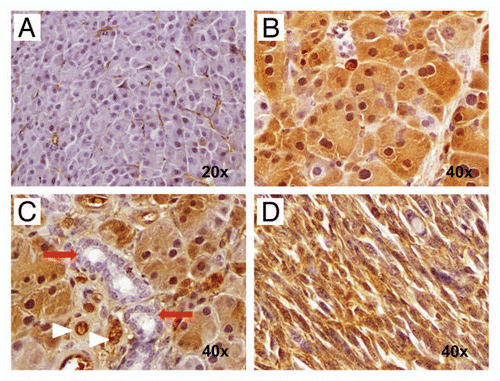
Figure 8 Inactivation of Brca2 promotes DNA damage in the exocrine pancreas. (A) Immunohistochemical staining for pH2AXSer139 shows minimal labeling within acinar cells in pancreatic tissue sections derived from hemizygous Pdx1-Cre; Brca2flox/wt mice (negativ function in CB mice results in markedly increased pH2AXSer139 immunolabeling in pancreatic acinar cells (B and C), but not in the ductal epithelia (red arrows). Note robust expression of pH2AXSer139 in two highly atypical acinar cell nuclei (white arrowheads). (D) Marked upregulation of pH2AXSer139 labeling in the sarcomatoid carcinoma component of a PDAC arising in a CBP mouse.

Figure 9 Hedgehog ligand is expressed by neoplastic glandular epithelium but not by the epithelium of non-neoplastic cysts. (A) and (B) Nuclear Pdx1, a marker of pancreatic progenitor cells not expressed in the mature ductal epithelium, is expressed within both neoplastic glands (A) as well as the lining epithelium of non-neoplastic cysts (B). (C and D) In contrast, Hh ligand, known to be overexpressed in most human PDAC, is expressed only by neoplastic glands (C) and not by the non-neoplastic cystic epithelium (D).
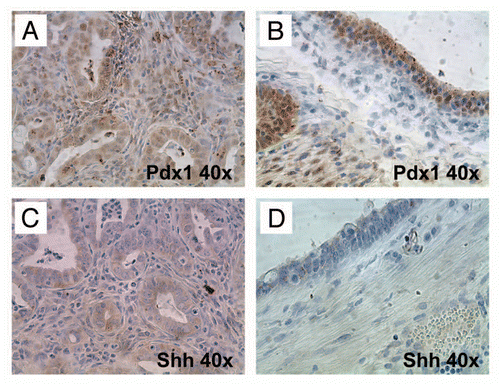
Figure 9 Hedgehog ligand is expressed by neoplastic glandular epithelium but not by the epithelium of non-neoplastic cysts. (A) and (B) Nuclear Pdx1, a marker of pancreatic progenitor cells not expressed in the mature ductal epithelium, is expressed within both neoplastic glands (A) as well as the lining epithelium of non-neoplastic cysts (B). (C and D) In contrast, Hh ligand, known to be overexpressed in most human PDAC, is expressed only by neoplastic glands (C) and not by the non-neoplastic cystic epithelium (D).