Figures & data
Figure 1. Sequence alignment prediction between miR-17 and ATG7 and validation assays. (A) miRanda predicted miR-17 targets (squares) within the 3′-UTR region (with nucleotides coordinates) of human ATG7 sequence (NM_006395). miRanda likelihood of miR-17-mediated mRNA downregulation scores (mirSVRs) are reported. (B) Nucleotide alignments between miR-17 seed sequence and ATG7 wild-type and mutated sequences, respectively cloned into pMIRATG7WT and pMIRATG7MUT vectors (see Materials and Methods) (top); results of the luciferase reporter assay at 24 and 48 h post-transfection (p.t.) in T98G cells are expressed as Relative Luciferase Units (left); results were normalized to pMIR-REPORT vector (vehicle) transfections. (C) Real-time PCR quantitative expression levels of miR-17 and ATG7 in T98G cells, from a RIP-assay using EIF2C2/AGO2-co-immunoprecipitated RNA, described in Materials and Methods; controls are represented by mock (input) and IgG isotype RNA samples. Expression levels are normalized to miR-17 and ATG7 expression levels of input samples. RIP-assay is performed using Protein A (top) and G sepharose matrices (bottom). Results of three independent replicas are indicated with error bars. *P < 0.005, **P < 0.001.
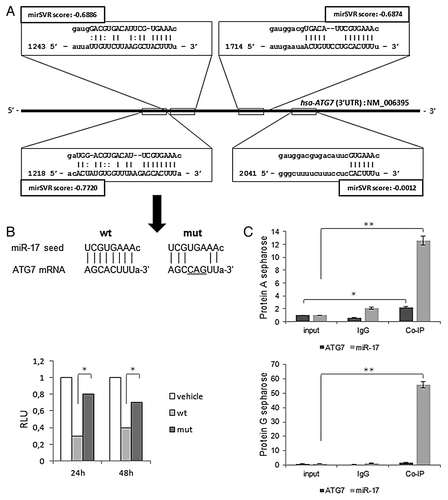
Figure 2. miR-17 modulation of ATG7 and LC3B expression in T98G cells. (A) Relative expression of miR-17 (Real-time PCR) and ATG7 protein (immunoblotting), in T98G cells, transfected with miR-17 specific inhibitor (2.5 μM) and precursor molecules (2.5 μM) evaluated at 72h p.t. Data are normalized using β-Actin mRNA/protein levels. (B) LC3B protein expression after miR-17 inhibitory or precursor treatments (as above) in absence/presence of BafilomycinA1 (10 nM). LC3B-II expression levels were calculated normalizing LC3B-II to β-actin expression, according to the current autophagy guidelines.Citation33 Protein expression and densitometric analysis using ImageJ tool are evaluated at 72h p.t. Results of three independent experiments are indicated with error bars. *P < 0.005, **P < 0.001.
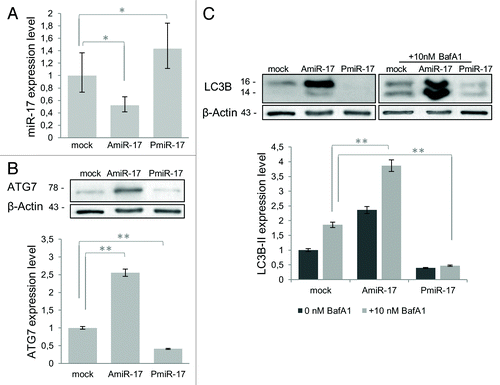
Figure 3. Combined effects of rapamycin and miR-17 inhibitor/precursor administration in T98G cells on LC3B and ATG7 protein expression. To evaluate the autophagy process activation by miR-17 modulation in T98G cells, rapamycin is administered at different concentrations (50−100 nM), after separate transfection of AmiR-17 or Pmir-17 molecules, at 2.5 µM concentration. LC3B-II and ATG7 protein expression, followed by densitometric analysis using ImageJ software, are evaluated after 72 h p.t. LC3B-II expression levels are calculated normalizing LC3B-II to β-Actin expression, according to the current autophagy guidelines.Citation33 Data are normalized using β-Actin protein levels and referred to mock untreated samples.
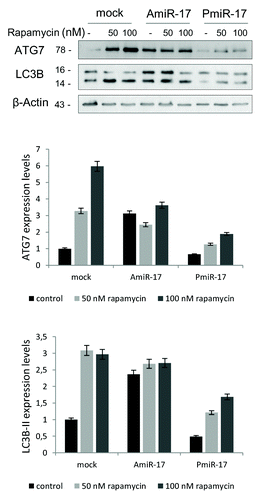
Figure 4. Autophagosomal LC3-FP expression in T98G cells after rapamycin and miR-17 inhibitor/precursor administration. T98G cells are transduced with BacMam LC3B-FP or BacMam LC3B(G120A)-FP viral particles (MOI = 30 each), and after 24 h treated with rapamycin (0−50−100 nM) or transfected with AmiR-17 or PmiR-17 (2.5 µM each). LC3B-FP or LC3B(G120A)-FP expression are analyzed after additional 24h. For DIC phase contrast-fluorescent photographs an inverted microscope (Eclipse TS100, Nikon) with 40× magnification is employed. (Scale bar: 10 μM).
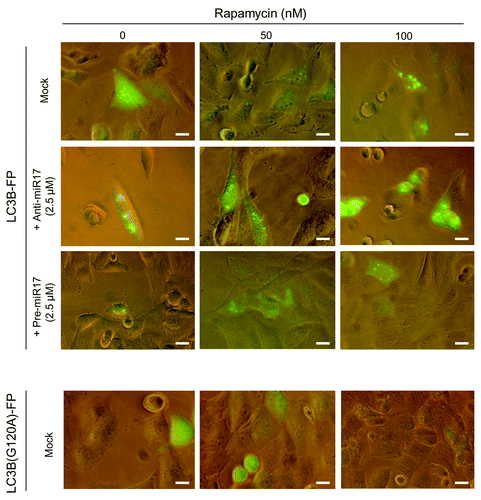
Figure 5. Autophagosomal LC3-FP evaluation in T98G cells after Rapamycyn and miR-17 inhibitor/precursor administration. Ratio percentage between vesicles area and cells areas (Aves/Atot [%]) and number of total vesicles (Vestot) are calculated using the AUTOCOUNTER ImageJ Javascript tool as described.Citation35 Results are obtained analyzing different DIC phase contrast-fluorescent photographs for a total of 30 T98G cells for each of the mentioned mock, rapamycin, AmiR-17, and PmiR-17 treatments. *P < 0.005.
![Figure 5. Autophagosomal LC3-FP evaluation in T98G cells after Rapamycyn and miR-17 inhibitor/precursor administration. Ratio percentage between vesicles area and cells areas (Aves/Atot [%]) and number of total vesicles (Vestot) are calculated using the AUTOCOUNTER ImageJ Javascript tool as described.Citation35 Results are obtained analyzing different DIC phase contrast-fluorescent photographs for a total of 30 T98G cells for each of the mentioned mock, rapamycin, AmiR-17, and PmiR-17 treatments. *P < 0.005.](/cms/asset/02ec0a0f-bb2f-4887-a3d2-005ee09932ef/kcbt_a_10924597_f0005.gif)
Figure 6. Combined effects of TMZ and miR-17 inhibitor (AmiR-17) treatment on short/long-term viability and ATG7/LC3B protein expression in T98G cells. T98G cells are transfected with AmiR-17 (2.5 μM) and, after 24 h, treated with TMZ (0−250−500 μM). (A) Short-term viability in T98G cells is evaluated using MTT assay after 48 h p.t. (B) For T98G long-term viability a clonogenic assay is performed after a two-weeks culturing condition. Statistics (number of clones and mean of each treatment) are reported in Table S1. (C) ATG7 and LC3B expression are evaluated by immunoblotting. For densitometric analysis, LC3B-II expression levels are calculated normalizing LC3B-II to β-actin expression, according to the current autophagy guidelines.Citation33 Results are normalized to mock untreated samples. **P < 0.001.
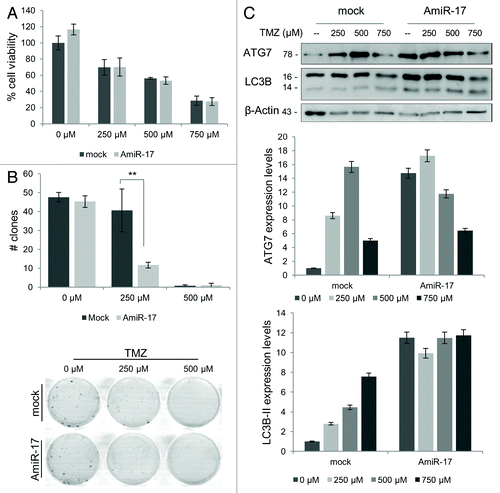
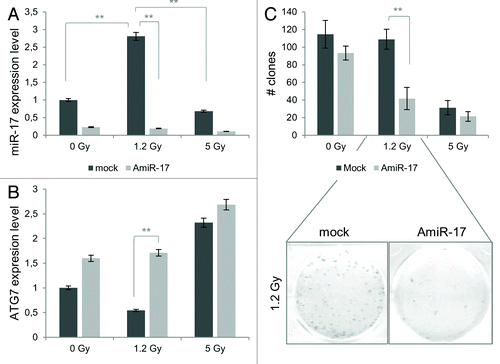
Figure 7. Combined effects of IR and miR-17 inhibitor (AmiR-17) treatment on miR-17/ATG7 expression and on long-term viability in U373-MG cells. (A) U373-MG cells are transfected with AmiR-17 (2.5 μM) 48 h before IR administration (0−1.2–5 Gy). miR-17 and ATG7 protein expression are evaluated by means of real-time quantitative PCR and immunoblotting/densitometric analysis, respectively. Results are normalized to mock untreated samples. (B) For U373-MG long-term viability a clonogenic assay is performed after a 2-weeks culturing condition. Statistics (clones number and mean of each treatment) are reported in Table S2. *P < 0.005, **P < 0.001.
