1,533
Views
31
CrossRef citations to date
0
Altmetric
Research Paper

Paxillin mutations affect focal adhesions and lead to altered mitochondrial dynamics

Relevance to lung cancer

, , , , , , , , , , , , , , , , , , , & show all
Pages 679-691 | Received 15 Mar 2013, Accepted 19 May 2013, Published online: 31 May 2013

Figures & data

Figure 1. (A) Diagram showing the structure of PXN and the position of mutations found in NSCLC patient samples. (B) Confocal images of HEK-293 cells transiently transfected with GFP tagged plasmid DNA containing various mutants of PXN. The panel represents photographs taken at a single time point of empty vector, wild-type, and each mutant.
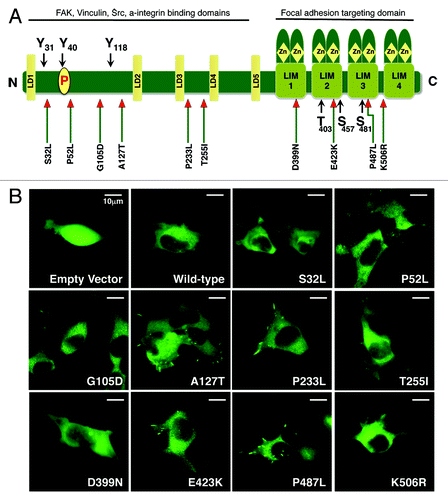
Figure 1. (A) Diagram showing the structure of PXN and the position of mutations found in NSCLC patient samples. (B) Confocal images of HEK-293 cells transiently transfected with GFP tagged plasmid DNA containing various mutants of PXN. The panel represents photographs taken at a single time point of empty vector, wild-type, and each mutant.

Table 1. The chart represents visual estimations of cell size, transfection strength, appearance of focal adhesions, filopodia, lamellipodia, cell mobility, and displacement over the period imaged

Figure 2. (A) Live-cell confocal images of HEK-293 cells expressing various mutants of PXN labelled with MitoTracker Red. The panel represents single time point photographs of untransfected parental HEK-293 cells, wild-type and mutant PXN. (B) Multiple images analysed with Imaris software show the number of mitochondria, mean intensity of MitoTracker Red indicating mitochondrial energy levels, and mean volume (indicating the level of average mitochondrial volume).
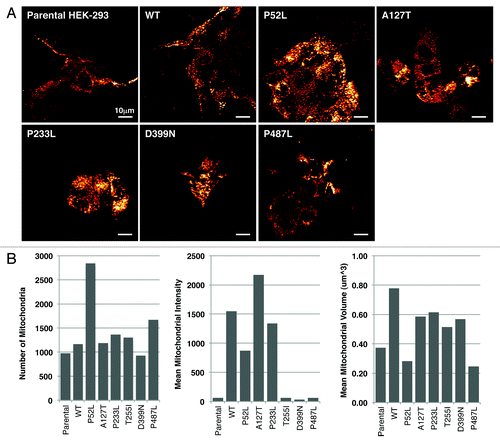
Figure 2. (A) Live-cell confocal images of HEK-293 cells expressing various mutants of PXN labelled with MitoTracker Red. The panel represents single time point photographs of untransfected parental HEK-293 cells, wild-type and mutant PXN. (B) Multiple images analysed with Imaris software show the number of mitochondria, mean intensity of MitoTracker Red indicating mitochondrial energy levels, and mean volume (indicating the level of average mitochondrial volume).

Table 2. The table represents visual estimations of mitochondrial appearance and localization within the cellular compartment of wild-type and mutant PXN

Figure 3. Effect of HGF stimulation on HEK-293 wild-type PXN and mutants shown in (A) confocal images after treatment with HGF and stained with MitoTracker Red and Hoechst and (B) measurements of mitochondrial functions by Imaris.
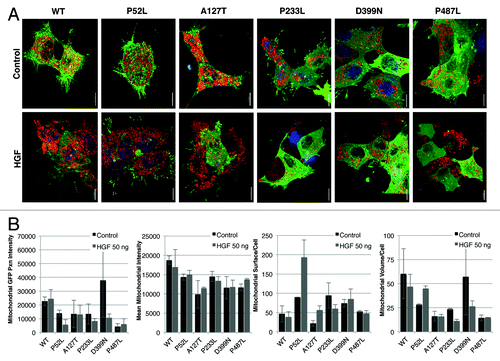
Figure 3. Effect of HGF stimulation on HEK-293 wild-type PXN and mutants shown in (A) confocal images after treatment with HGF and stained with MitoTracker Red and Hoechst and (B) measurements of mitochondrial functions by Imaris.

Figure 4. (A) HEK-293 cells were treated with HGF, and total protein lysates were immunoassayed to detect expression levels of PXN, DRP-1, MFN-2, phospho-DRP 616, phospho-DRP 637, total BCL-2, and phospho-BCL-2. (B) BCL-2 was immunoprecipitated and then blotted for PXN to assess association between BCL-2 and PXN. These blots show wild-type and mutant PXN binding to BCL-2 and their association with DRP-1 and MFN-2 in response to HGF treatment. The BCL-2 blot shows levels of BCL-2 immunoprecipitated from each sample.
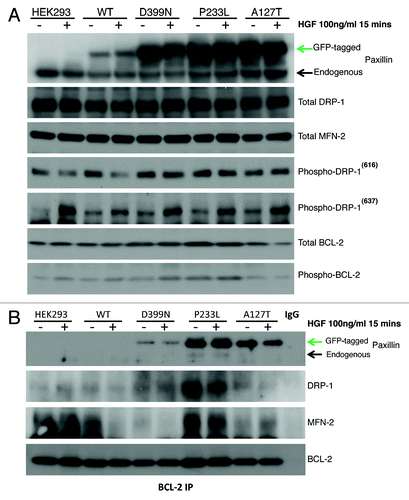
Figure 4. (A) HEK-293 cells were treated with HGF, and total protein lysates were immunoassayed to detect expression levels of PXN, DRP-1, MFN-2, phospho-DRP 616, phospho-DRP 637, total BCL-2, and phospho-BCL-2. (B) BCL-2 was immunoprecipitated and then blotted for PXN to assess association between BCL-2 and PXN. These blots show wild-type and mutant PXN binding to BCL-2 and their association with DRP-1 and MFN-2 in response to HGF treatment. The BCL-2 blot shows levels of BCL-2 immunoprecipitated from each sample.

Figure 5. Viability of HEK-293 stably expressing wild-type PXN or mutant cells treated with cisplatin for 72 h. The graph represents percentage of cells viable after cisplatin treatment as compared to cells treated with vehicle (DMSO) only.
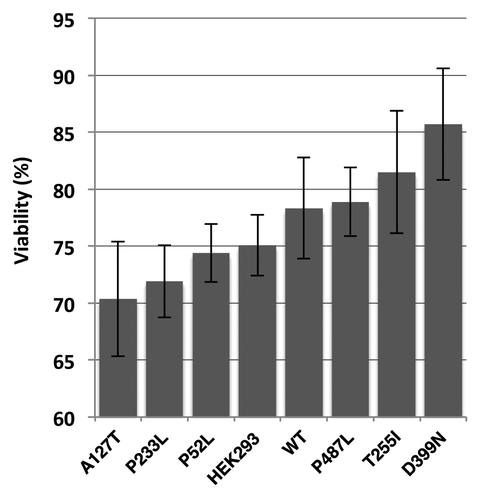
Figure 5. Viability of HEK-293 stably expressing wild-type PXN or mutant cells treated with cisplatin for 72 h. The graph represents percentage of cells viable after cisplatin treatment as compared to cells treated with vehicle (DMSO) only.

Figure 6. (A) Survival outcome analysis in NSCLC patients with wild-type versus mutated PXN. Left and right graphs show overall and individual mutant survival curves, respectively. The relative expression of PXN, p-PXN, BCL-2, FAK, phospho-FAK, Cox IV, DRP-1, and MFN-2 was evaluated by IHC on two sets of samples; seven NSCLC patient samples bearing wild-type PXN and six NSCLC patient samples that were identified to have various PXN mutations as shown in (B). (C and D) represent the averaged staining intensity scores among all WT and all mutants. (E) Shows graph of staining intensity scores of the proteins assayed as expressed in the cytoplasm of the cells. (F)The panel shows photographs of IHC stains represented in one wild-type and one mutant sample.
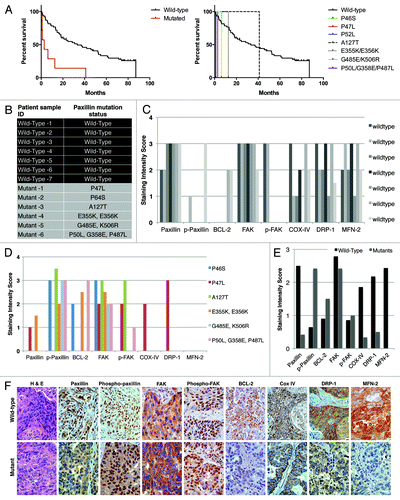
Figure 6. (A) Survival outcome analysis in NSCLC patients with wild-type versus mutated PXN. Left and right graphs show overall and individual mutant survival curves, respectively. The relative expression of PXN, p-PXN, BCL-2, FAK, phospho-FAK, Cox IV, DRP-1, and MFN-2 was evaluated by IHC on two sets of samples; seven NSCLC patient samples bearing wild-type PXN and six NSCLC patient samples that were identified to have various PXN mutations as shown in (B). (C and D) represent the averaged staining intensity scores among all WT and all mutants. (E) Shows graph of staining intensity scores of the proteins assayed as expressed in the cytoplasm of the cells. (F)The panel shows photographs of IHC stains represented in one wild-type and one mutant sample.
Supplemental material

Additional material

Download Zip (14 MB)