Figures & data
Scheme 1. Construction of a Nα-linked B1R/B2R agonist heterodimer utilizing “click” chemistry and Aca linker. Chemistry conjugation reaction between an alkyne-containing B1R agonist molecule (Fmoc-G(propargyl)-Aca-Lys-Arg-Pro-Pro-Gly-Phe-Ser-Pro-DPhe-OH) and an azide-containing B2R agonist molecule (Boc-Lys(N3)-Arg(Pdf)-Pro-Hyp(t-Bu)-Gly-Thi-Ser(t-Bu)-NChg-Thi-Arg(Pbf)). The peptide B1R agonist (in solution) and the peptide B2R agonist (immobilized on the solid-phase) were then joined at their N-terminal side via a triazole linker, made by “click” chemistry. Heterodimer was then deprotected, cleaved from resin and purified to homogeneity by using RP-HPLC and mass spectrometry. Abbreviations: Aca, ε-aminocaproyl; HFIP, 1,1,1,3,3,3-hexafluoroisopropanol; TFE, 2,2,2-trifluoroethanol; TIPS, triisopropylsilane; TFA, trifluoroacetic acid; Aca, 6-amino caproic acid; t-BuOH, tert-butanol. Hyp, trans-4-hydroxy-l-proline; Thi, β-(2-thienyl)-l-alanine; NChg, N-cyclohexyl-glycine.
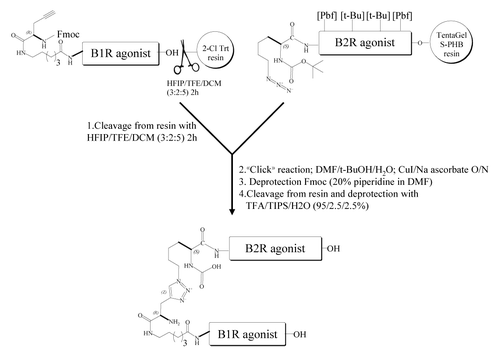
Table 1. Receptor binding affinity and pharmacological activity of kinin derivatives at human B1R and B2R
Figure 1. Differential vasoconstrictor actions of natural B2R and B1R agonists, bradykinin (BK), and desArg9BK and the newly-developed heterodimeric B1R/B2R agonist in the isolated human (endothelium-denuded) umbilical veins. Representative tracings (of three replicates) of the vasoconstrictor responses induced by kinin agonists, are shown. Agonists were tested at concentrations near their EC50 value (see ). Note the important long, sustained duration of action of the heterodimer.
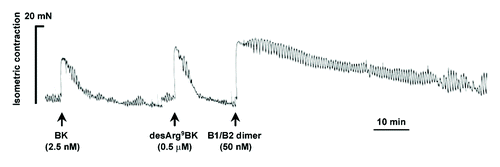
Figure 2. Comparison of contrast-agent distribution and uptake in the brain following intraarterial administration of B1R and B2R agonists. Brain tumors were induced by intracranial injection of 1 × 10⁴ F98 glioma cells on day 0. MRI experiments were performed 10 d after tumor transplantation; whole set of acquired images consisted of 10 axial, contiguous slices with a thickness equal to 1.5 mm. The schematic diagram shows MRI slices in which measurements were taken. (A) Representative axial Gd-DTPA-enhanced T1-weighted MR images depicting the brain of an F98-implanted rat before and after intracarotid B1R/B2R dimer agonist treatment (50 nmol/kg/min for 5 min). Regions of contrast enhancement related to Gd-DTPA are highlighted in pseudo-colors. Contrast agent distribution volume (CADV) as a function of time calculated from the corresponding set of images (bottom panel). (B) Relative CADV in percent determined following the infusion of the vehicle (saline), B1R agonist NG29, B2R agonist NG291, NG29+NG291, or B1R/B2R dimer agonist. Agonists were given at the dose of 50 nmol/kg/min for 5 min (i.c.). Each bar represents the mean ± SEM for 4 to 6 animals. The differences between treatment groups were examined using the Student unpaired t test. *Statistical significance (P < 0.05). Methods of these experiments based on MRI are presented elsewhere.Citation6,Citation7
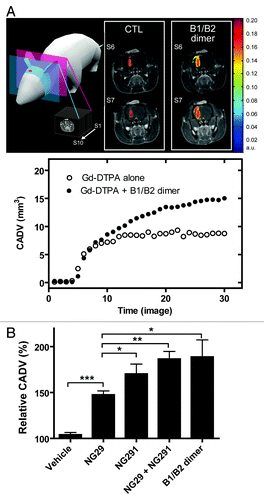
Figure 3. Differential effects of synthetic B1R and B2R agonists on tumor and tissue uptake of the chemotherapy drug carboplatin and the contrast agent Gd-DTPA. Direct measures of drug concentration (ng/g of wet tissue) by ICP-MS in three different tissue extracts (tumor, tumor periphery and contralateral) from the brains of F98 glioma-bearing Fischer rats were made following intra-arterial (internal carotid) injections of Gd-DTPA (Gd) (143 mM i.v.) and carboplatin (Pt) (20 mg/kg) with various agonists (250 nmol/kg) or saline (CTRL) in a single 1-ml infusion over 10 min. Five minutes after the end of the infusion, rats were euthanized and the brain rapidly removed, dissected into regions, and prepared for ICP-MS analysis. Differences were examined by the Student unpaired t test, considering P < 0.05 siginificant. General methods as in Côté et al.Citation6
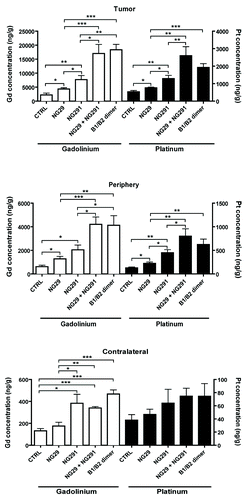
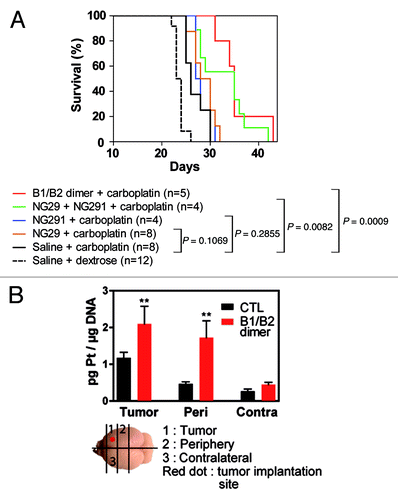
Figure 4. Dual B1R/B2R agonist treatment enhances the in vivo antitumor activity of carboplatin. (A) Kaplan–Meier survival curves of F98 glioma-bearing rats. F98 glioma cells (1 × 10⁴ cells) were inoculated on day 0. MRI scans were performed on day 9 in the animal groups (2−3 rats/group) to confirm the presence and size of tumors before the beginning of the treatments. On day 10, animals were treated with the vehicle, agonists alone or in combination (50 nmol/kg/min i.c; 0.5 ml over 5 min) followed by carboplatin (20 mg/kg; 1 ml over 10 min). Survival curves were compared with the log-rank test. (B) Pt-DNA adducts in tumors, tumor periphery and contralateral tissues from F98 glioma-bearing Fischer rats treated with carboplatin in combination or not with the B1R/B2R dimer agonist as above. Brain slices (100−200 mg) were collected 24h after the administration of the drugs and immediately snap frozen in liquid nitrogen. A diagram depicting how the schematic slices were taken is shown. Frozen rat brain tissues were cut into pieces and digested with RNase A and Proteinase K in the presence of SDS detergent. Genomic DNA was extracted by the phenol/chloroform method and its purity estimated from the 260/280 nm-absorbance ratio. DNA samples were then analyzed for their Pt content by ICP-MS as described in Côté et al.Citation5P < 0.05 as determined by the Dunnett test; n = 3−4 animals per group.