895
Views
28
CrossRef citations to date
0
Altmetric
Report

p16/p53 expression and telomerase activity in immortalized human dental pulp cells

, , , , &
Pages 3912-3919 | Received 04 Jul 2011, Accepted 14 Sep 2011, Published online: 15 Nov 2011

Figures & data

Figure 1 Optical phase contrast microphotographs showing the morphology tDPSCs and nDPSCs under phase contrast microscopy (x400) during the growth phase, day 3 (A and C) and at confluence, day 7 (B and D). Also shown is some immunopositive staining of tDPSCs and nDPSCs.
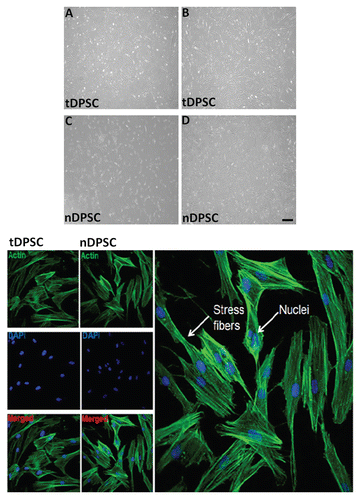
Figure 1 Optical phase contrast microphotographs showing the morphology tDPSCs and nDPSCs under phase contrast microscopy (x400) during the growth phase, day 3 (A and C) and at confluence, day 7 (B and D). Also shown is some immunopositive staining of tDPSCs and nDPSCs.

Figure 2 Relative fluorescent readings used to assess telomerase activity in tDPSCs and nDPSCs after the introduction of exogenous HTERT. The results are expressed as the means ± SD (n = 4, *p < 0.001).
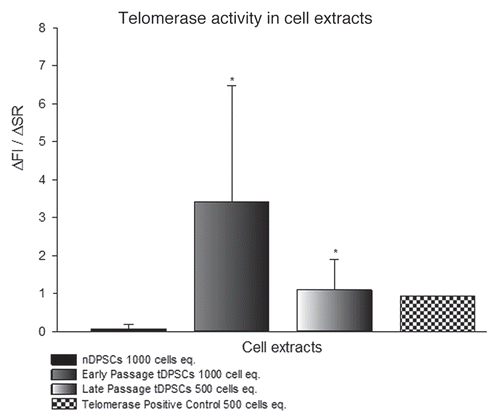
Figure 2 Relative fluorescent readings used to assess telomerase activity in tDPSCs and nDPSCs after the introduction of exogenous HTERT. The results are expressed as the means ± SD (n = 4, *p < 0.001).

Figure 3 β-galactosidase staining in cultured human dental pulp stem cells. Cells were stained and photographed at 100x (A and C) or 200x (B and D) magnification. (A and B) Early passage nDPS C showing > 80% positivity and (C and D) Late passage tDPSCs showing < 10% positivity for β-galactosidase staining both depicted in the graph above. Positive staining disappeared after re-plating tDPSCs.
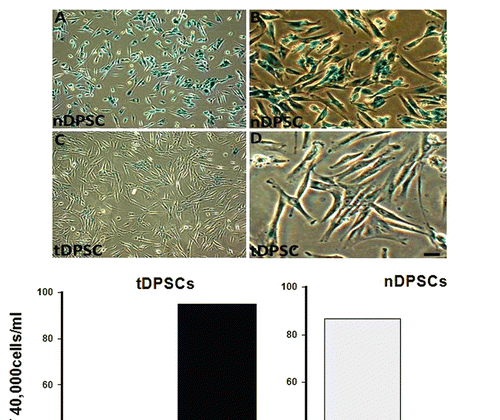
Figure 3 β-galactosidase staining in cultured human dental pulp stem cells. Cells were stained and photographed at 100x (A and C) or 200x (B and D) magnification. (A and B) Early passage nDPS C showing > 80% positivity and (C and D) Late passage tDPSCs showing < 10% positivity for β-galactosidase staining both depicted in the graph above. Positive staining disappeared after re-plating tDPSCs.

Figure 4 RT-PCR results for odontoblastic differentiation genes (ALP, cbfa-1, Col-1, DMP-1, DSPP, Osteopontin and Osteocalcin) and growth regulating factors p16, p21 and p53. Lane A, tDPSCs and Lane B, nDPSCs. GAPDH was run as an internal control and water as the negative control for both groups.
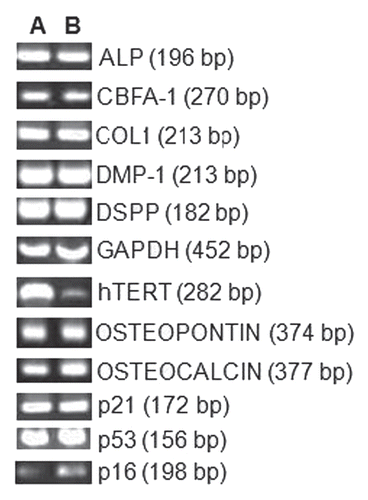
Figure 4 RT-PCR results for odontoblastic differentiation genes (ALP, cbfa-1, Col-1, DMP-1, DSPP, Osteopontin and Osteocalcin) and growth regulating factors p16, p21 and p53. Lane A, tDPSCs and Lane B, nDPSCs. GAPDH was run as an internal control and water as the negative control for both groups.

Figure 5 Analyses of cell proliferation using a DNA assay (A) and cell mineralization by way of an ALP assay (B) in tDPS C and nDPS C cell groups. The experiments were performed in triplicate. The values are means of the absorbance readings at 490 nm ± SD (n = 4, *p < 0.001).
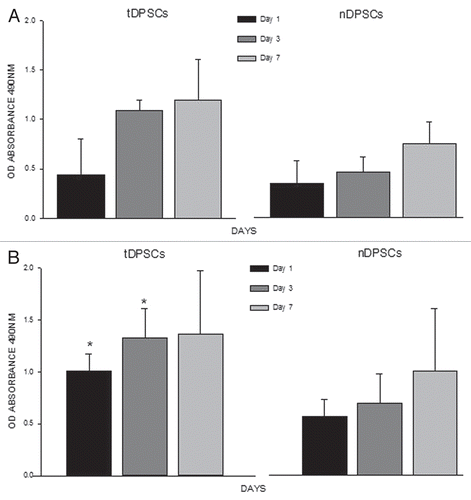
Figure 5 Analyses of cell proliferation using a DNA assay (A) and cell mineralization by way of an ALP assay (B) in tDPS C and nDPS C cell groups. The experiments were performed in triplicate. The values are means of the absorbance readings at 490 nm ± SD (n = 4, *p < 0.001).

Table 1 Primer sequences and cycling conditions for the genes analyzed

Reprints and Corporate Permissions

Please note: Selecting permissions does not provide access to the full text of the article, please see our help page How do I view content?

To request a reprint or corporate permissions for this article, please click on the relevant link below:

Academic Permissions

Please note: Selecting permissions does not provide access to the full text of the article, please see our help page How do I view content?

Obtain permissions instantly via Rightslink by clicking on the button below:

If you are unable to obtain permissions via Rightslink, please complete and submit this Permissions form. For more information, please visit our Permissions help page.